
Figure 1.
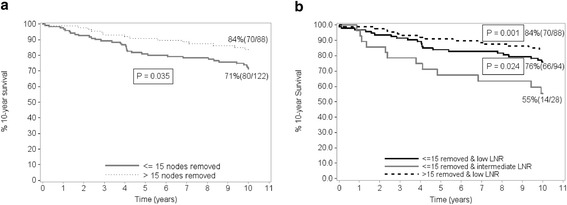
Kaplan-Meier breast cancer specific survival estimates according to the number of nodes removed. (a) shows overall survival for pN1 (1–3) stage. Numbers in parentheses indicate total number and number at risk. (b) shows overall survival for pN1 (1–3) stage by LNR. Numbers in parentheses indicate total number and number at risk. There were no cases from high risk LNR for ≤ 15 nodes removed. All cases for pN1 stage were low-risk LNR for > 15 nodes removed. P values are from the log rank-test with intermediate LNR as the reference.