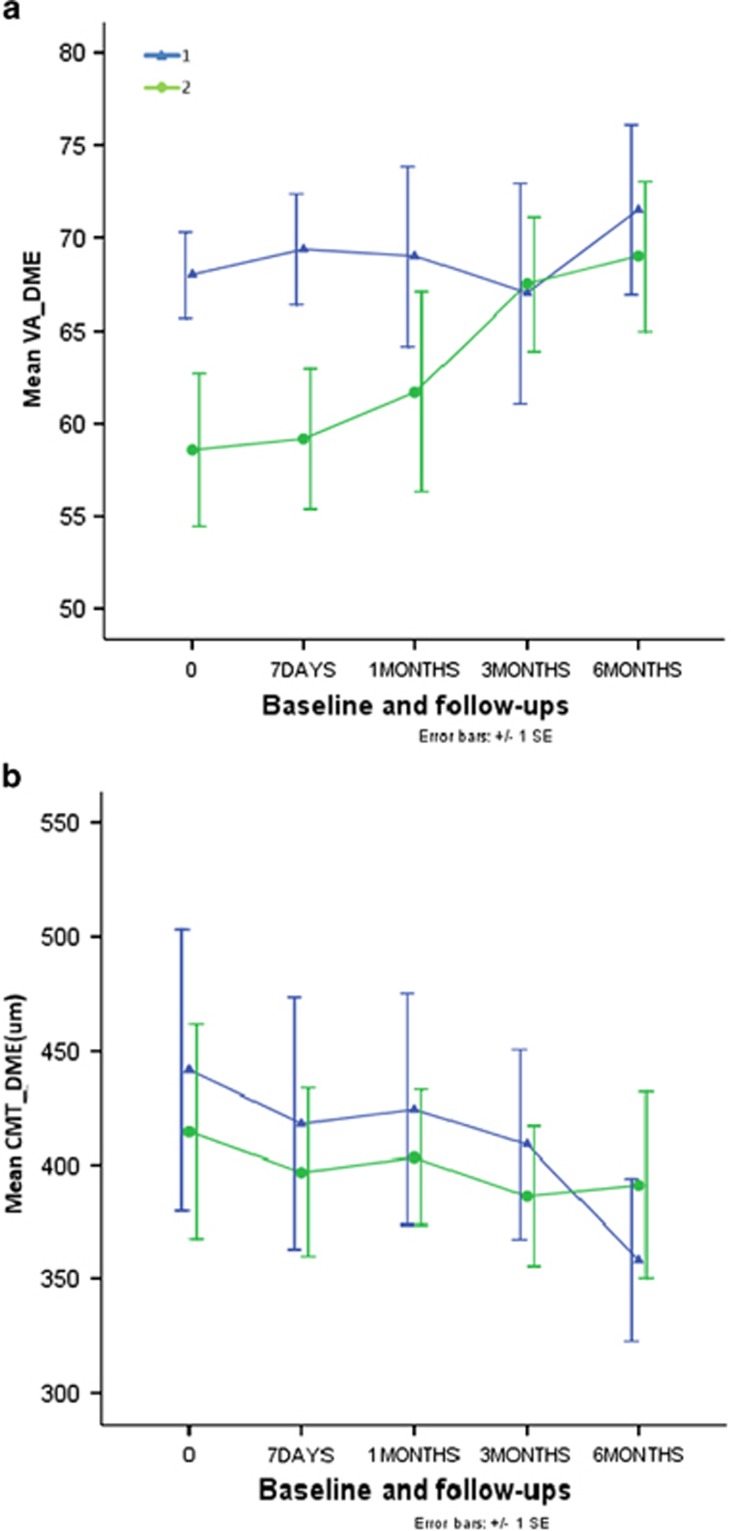
Figure 1.
(a) Mean BCVA at baseline and follow-ups. 1, subthreshold laser photocoagulation group; 2, threshold laser photocoagulation group. x axis: follow-up time points; y axis: mean BCVA of ETDRS visual chart. (b) Mean CMT at baseline and follow-ups. 1, subthreshold laser photocoagulation group; 2, threshold laser photocoagulation group. x axis: follow-up time points; y axis: BCVA of ETDRS visual chart.

