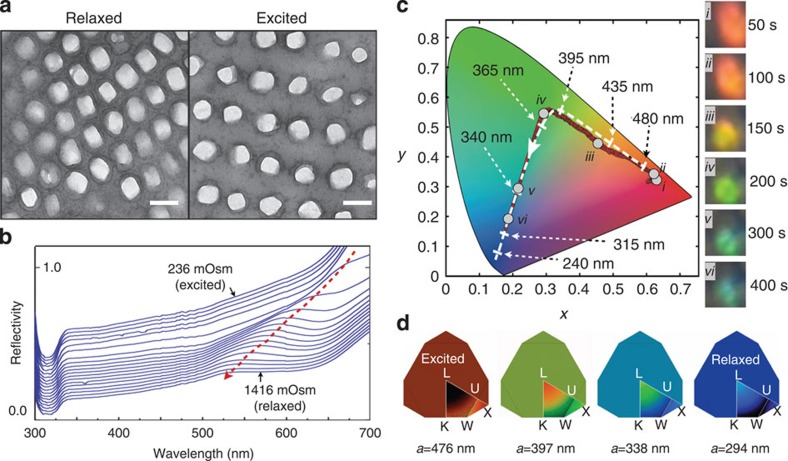
Figure 2. In-vivo skin colour change in chameleons is reproduced ex vivo.
(a) TEM images of the lattice of guanine nanocrystals in S-iridophores from the same individual in a relaxed and excited state (two biopsies separated by a distance <1 cm, scale bar, 200 nm). This transformation and corresponding optical response is recapitulated ex vivo by manipulation of white skin osmolarity (from 236 to 1,416 mOsm): (b) reflectivity of a skin sample (for clarity, the 19 reflectivity curves are shifted by 0.02 units along the y axis) and (c) time evolution (in the CIE chromaticity chart) of the colour of a single cell (insets i–vi; Supplementary Movie 4); both exhibit a strong blue shift (red dotted arrow in b) as observed in vivo during behavioural colour change. Dashed white line: optical response in numerical simulations (cf. Fig. 1b) with lattice parameter indicated with dashed arrows. Note that increased osmotic pressure corresponds to behavioural relaxation; hence, the reverse order (white arrowhead in CIE colour chart) of red to green to blue time evolution in comparison with Fig. 1b. (d) Variation of simulated colour photonic response for each vertex of the irreducible first Brillouin zone (colour outside of the Brillouin zone indicates the average among all directions) shown for four lattice parameter values (from Supplementary Movie 5) of the modelled photonic crystal. L-U-K-W-X are standard symmetry points.

