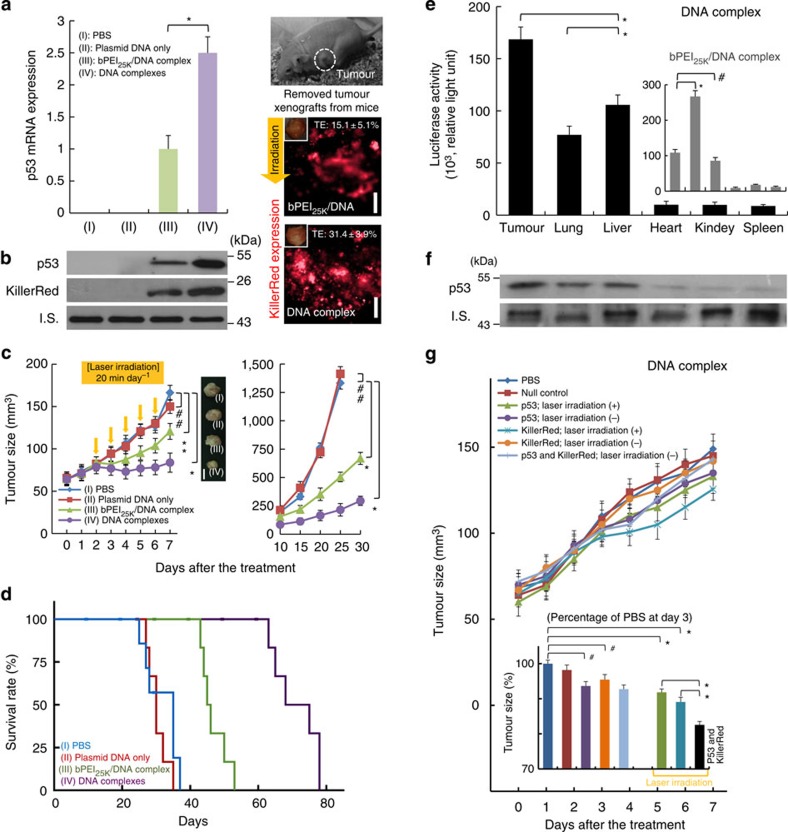
Figure 4. Gene expression in an aggressive H1299 mouse-tumour model after a single administration.
(a) The p53 mRNA expression after tail vein injection; comparing PBS, plasmid DNA only, bPEI25K/DNA-complex and DNA-complex 48 h post injection (*P<0.00015; based on a two-tailed t-test, assuming unequal variances). Representative fluorescence images of excised tumour from mice 48 h after tail vein injection. Scale bar, 2 mm. The percentage of KillerRed-positive cells as TE was measured by flow cytometry. (b) Protein levels in tumour 2 days after tail vein injection of various complex formulations containing 10 μg pCMV-p53 and 10 μg pKillerRed-mem. Western blot analysis was performed using anti-p53 and KillerRed antibodies. β-actin protein was used as an internal standard. Total mRNA was isolated and determined for p53 by quantitative real-time reverse-transcription PCR analysis. (c) Effect of pH-targeting and control complexes on tumour volumes by tail vein injection. Mice were injected with various complex formulations and H1299 subcutaneous tumour volumes were measured (*P<0.00015; **P=0.013; ##P>0.1; based on a two-tailed t-test, assuming unequal variances). Representative samples of H1299 tumours excised on day 8 after a single treatment administration. Scale bar=5 mm. (d) Kaplan–Meier survival curve of mice treated with single doses by tail vein injection (e) Biodistribution of reporter expression after tail vein injection. Luciferase biodistribution at 48 h after injection was studied for DNA-complex or bPEI25K/DNA-complex containing 20 μg pCMV-luciferase (*P<0.005; #P=0.11; based on a two-tailed t-test, assuming unequal variances). Inset shows the data of bPEI25K/DNA-complex. (f) Protein levels of p53 in tumour and organs 2 days after tail vein injection. (g) Bystander effect on H1299 subcutaneous tumour volumes by tail vein injection of various complex formulations. Inset shows a zoomed-in view of the same data. Tumour size is given as the percentage of tumour volume (mm3) after treatment for 3 days, compared against the PBS treatment (*P<0.005; #P<0.05; based on a two-tailed t-test, assuming unequal variances). All results show mean of measurements conducted in sextuplicate±s.d.

