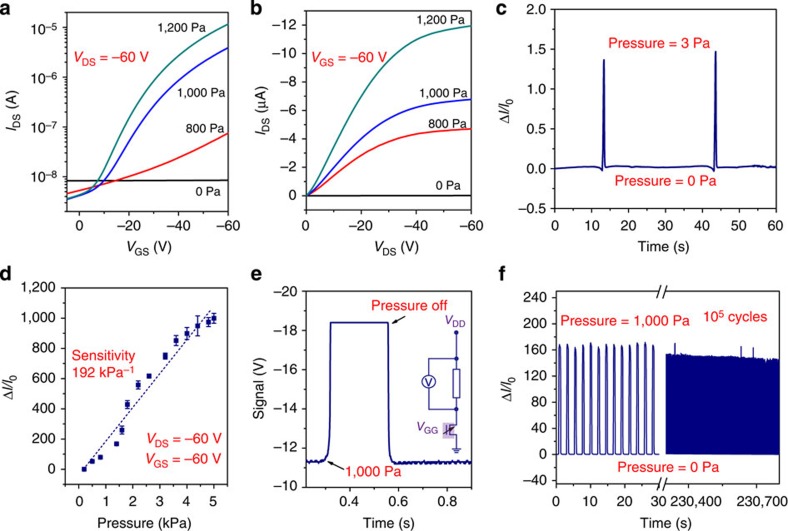
Figure 2. Fundamental electric response and performance data for the SGOTFTs.
(a) Transfer and (b) output curves of a SGOTFT sensor taken at different applied pressures. (c) Current response of a SGOTFT to the pressure of 3 Pa. (d) Pressure response of the source-drain current at constant voltage VDS=−60 V and VGS=−60 V. The error bars represent 1 s.d. (e) Oscilloscope recorded time-resolved response of a SGOTFT to a pressure of 1,000 Pa. The inset shows the electrical equivalent circuit of the measurement system. The response and relaxation time are lower than 10 ms. (f) The durability test of a SGOTFT under a pressure of 1,000 Pa.

