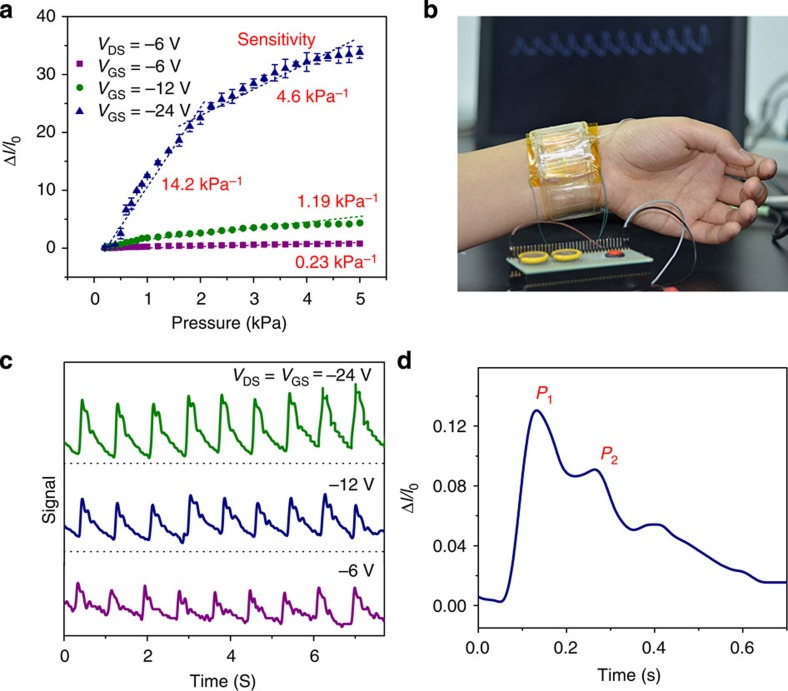
Figure 5. Pulse wave measurement.
(a) Pressure sensitivity of the SGOTFT device under different VGS. The error bars represent 1 s.d. (b) Photograph of battery-powered SGOTFT attached to the artery of the wrist. (c) The signal curves of real-time pulse wave under different voltages. (d) A magnified curve of average pulse wave signal from five devices (separate measurement): P1, P2 and diastolic wave are observed clearly.

