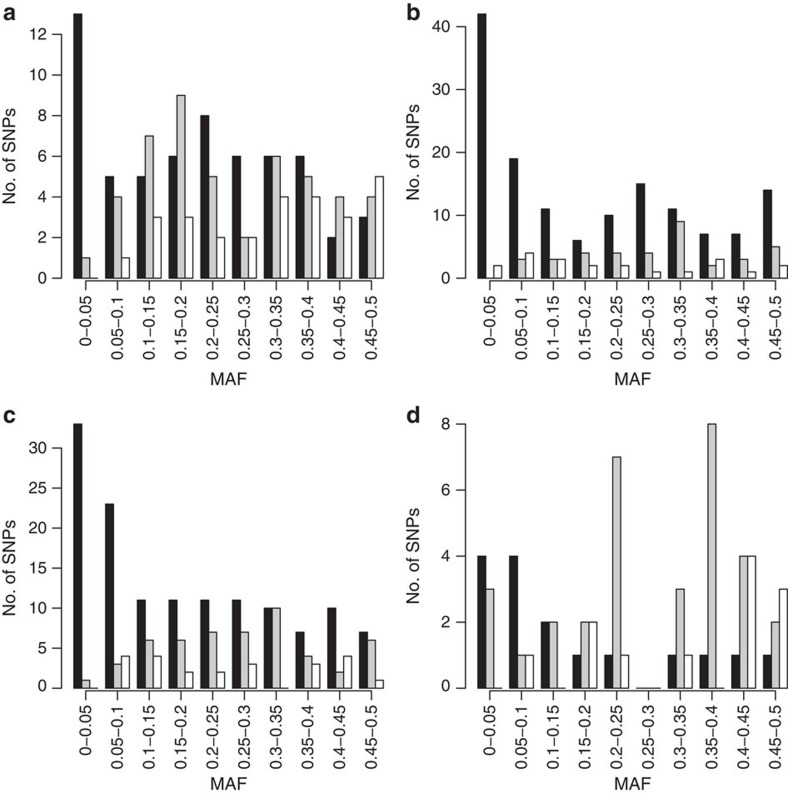
Figure 1. Identified variants for plasma lipid levels.
Distribution of the variants identified by conditional analysis implemented by GCTA to be independently associated with the lipid traits (a) HDL-C (60 variants), (b) LDL-C (142 variants), (c) TC (134 variants) and (d) TG (16 variants)) over MAF bins after meta-analysis of discovery cohorts (black). The histograms also include loci identified in ref. 1 (grey) and ref. 2 (white).

