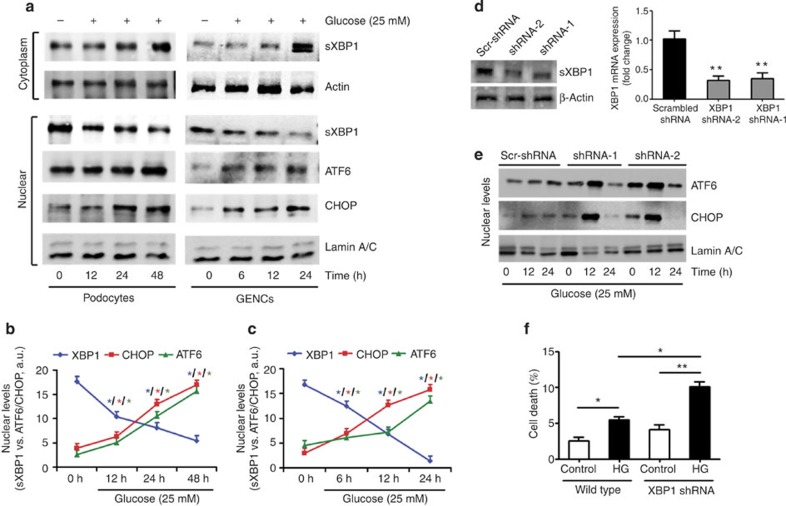
Figure 4. XBP1 limits hyperglycaemia-induced ER-stress response in glomerular cells.
(a–c) Representative immunoblots showing cytoplasmic (a, top panel) and nuclear levels (a, lower panel) of ER transcription factors in immortalized mouse podocytes (left panel) and human glomerular endothelial cells (right panel) at indicated time points after treatment with high glucose (25 mM). Line graphs (b, podocytes and c, glomerular endothelial cells) reflecting the mean±s.e.m. of six independent experiments. (d–f) Representative immunoblot showing shRNA-mediated knockdown of XBP1 in immortalized mouse podocytes (d, left panel). Results for two independent shRNAs (shRNA-1 and -2) and a non-specific scrambled-shRNA (Scr-shRNA) are shown. Bar graph showing reduction of XBP1 expression in XBP1KD cell lines, as determined by qRT–PCR (d, right panel). Representative immunoblots showing nuclear levels of cleaved ATF6 and CHOP in immortalized mouse control (Scr-shRNA) and XBP1 knockdown (shRNA-1 and -2) podocytes at indicated time points after treatment with high glucose (25 mM, e). Bar graph summarizing frequency (mean±s.e.m. of three independent experiments) of apoptotic cells as determined by TUNEL in immortalized mouse control and XBP1 knockdown podocytes 24 h after treatment with high glucose (25 mM, f). GENCs (glomerular endothelial cells); Mean±s.e.m. (b–d,f); *P<0.05, **P<0.01 (b–d: ANOVA; f: t-test).

