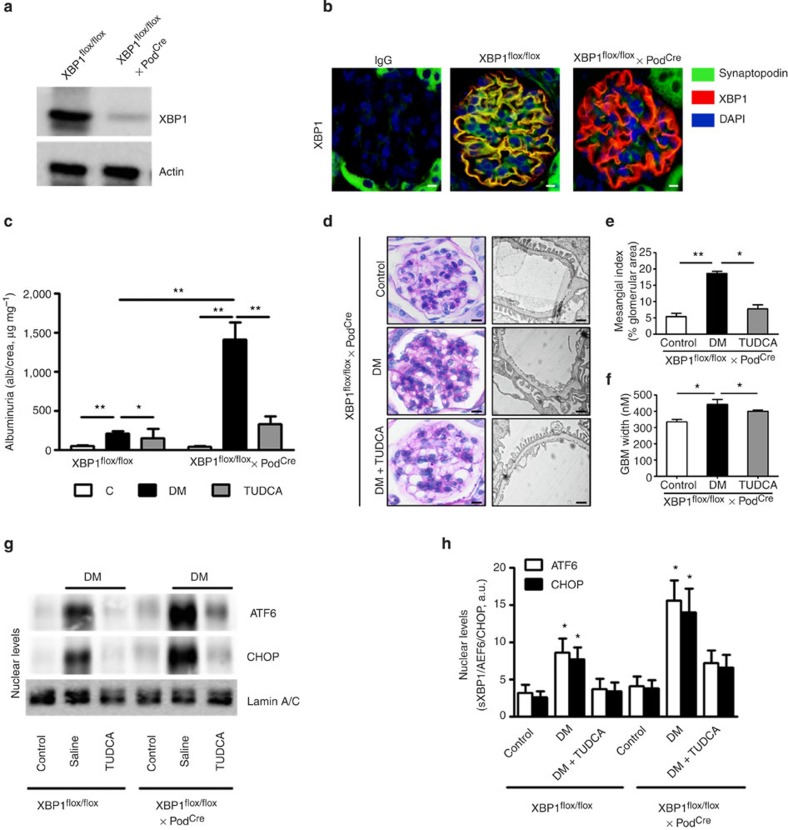
Figure 5. Podocyte-specific loss of XBP1 promotes maladaptive UPR in DN.
Analyses of mice with podocyte-specific loss of XBP1 (XBP1flox/flox x PodCre) compared with control mice (XBP1flox/flox). (a) Representative immunoblot images showing podocyte-specific nearly complete deletion of XBP1 in podocytes isolated from XBP1flox/flox x PodCre mice when compared with podocytes isolated from control mice (Xbp1flox/flox). (b) Exemplary images showing podocyte-specific depletion of XBP1 in glomeruli of wild-type (XBP1flox/flox) mice and XBP1flox/flox crossed with PodCre. (c–h) Analyses of DN in mice with podocyte-specific loss of XBP1. Bar graph summarizing albuminuria (c), representative images of the extracellular matrix deposition (d, left panel, PAS staining) and the glomerular filtration barrier (d, right panel, transmission electron microscopy, TEM), bar graph reflecting extracellular matrix deposition (e), glomerular basement membrane thickness (f), representative immunoblots (g) and bar graph (h) showing nuclear levels of ER transcription factors in renal cortex samples; (n=8 mice per group were analysed; for TEM (d) n=3 mice per group were analysed). C=control mice without diabetes, open bars; DM=diabetes, black bars; scale bar represents (d: 20 μm for PAS stain, 2 μm for glomerular filtration barrier, TEM); Mean±s.e.m. (c,e–h), *P<0.05, **P<0.01 (c–g: ANOVA; h: t-test).

