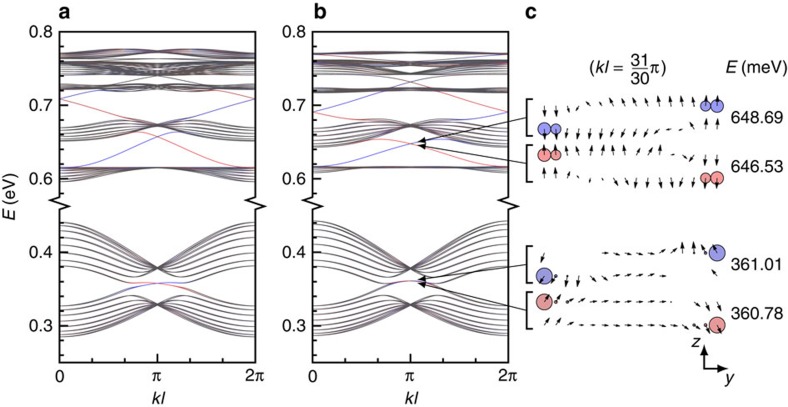
Figure 2. Topological edge states and non-trivial gaps in honeycomb lattices of HgTe nanocrystals.
(a) Conduction bands calculated using the atomistic TB method for a zigzag ribbon composed of 16 nanocrystals per unit cell (q=0.5, body diagonal of 5.0 nm, cell length l=8.7 nm). (b) Same but computed from the effective Hamiltonian. (c) Spin orientation on each site for a selection of states calculated at k=31π/(30l). A vertical arrow indicates that the spin is along the z direction, perpendicular to the lattice. The size of the circles represents the weight of the wavefunction on each site. In each figure, the colour indicates the expectation value ‹yσz›, that is, red and blue correspond to top and bottom edge for spin up (bottom and top edge for spin down), respectively. At each energy E, there are two states that live on opposite edges with opposite spin; therefore, they are represented by the same colour. The bulk states are grey.

