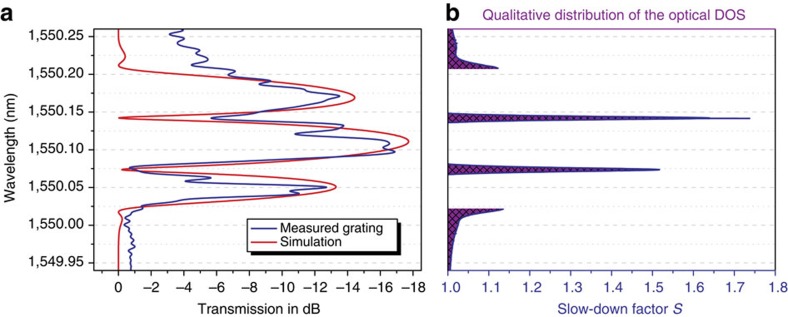
Figure 3. Simulation of the PBG structure and the group index.
(a) High-resolution grating spectrum and simulated grating spectrum obtained by solving the coupled equations for the transmitted and reflected waves in the waveguide. (b) Calculated slow-down factor S from the simulated grating. The graph also represents qualitatively the distribution of the DOS in the waveguide.

