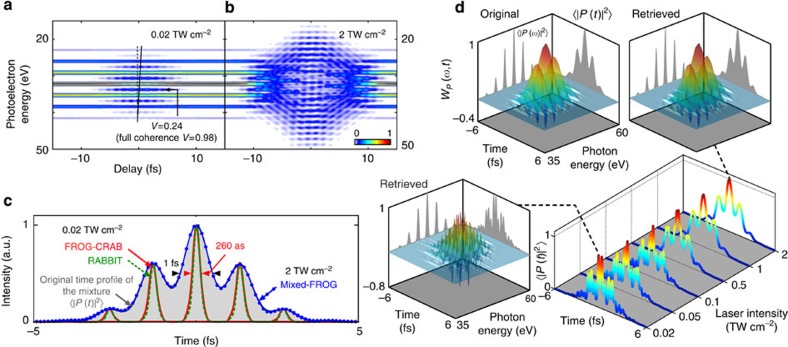
Figure 2. Low coherence RABBIT measurement.
RABBIT trace in the presence of partial coherence for a laser intensity of (a) 0.02 TW cm−2 and of (b) 2 TW cm−2. The tilted black line in a indicates the variation of the attosecond group delay, the effective and coherent contrasts V of one of the sidebands are also reported. (c) Attosecond pulse train retrieved from the trace in a using FROG-CRAB (red continuous line) and RABBIT (green dashed line), and retrieved by Mixed-FROG (blue circles) from the trace in b. The grey shaded curve represents the temporal marginal of the original Wigner function WP (ω, t) of the mixture. (d) Temporal marginals retrieved with Mixed-FROG for different laser intensities. Inset: original and retrieved Wigner functions of the attosecond pulse train.

