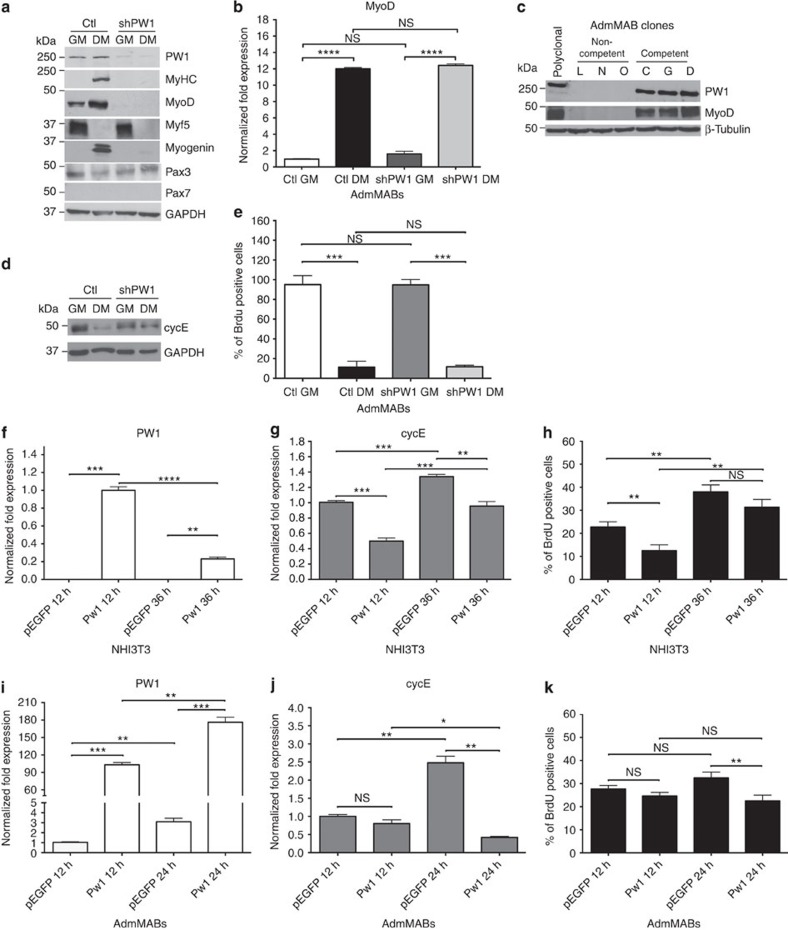
Figure 2. PW1 is necessary for MAB myogenic competence and negatively regulates cyclinE expression.
(a) Western blot for PW1 and myogenic markers expressed by Ctl and shPW1 AdmMABs. GAPDH was used to normalize. GM, growing medium; DM, differentiation medium. (b) MyoD expression by qRT–PCR on Ctl and shPW1 AdmMABs in GM and DM. Values are plotted as relative fold expression and normalized to GAPDH expression. Each assay was performed in triplicate. Data are represented as means ± s.d. ****P<0.0001, NS, not significant one-way unpaired t-test. (c) Western blot for PW1 and MyoD expression on non-competent (L, N, O) and competent (C, G, D) AdmMAB clones. β-Tubulin was used to normalize. (d) Western blot for cycE expression in Ctl versus shPW1 AdmMABs in growing and differentiating conditions. GAPDH was used to normalize. (e) 5′-bromo-deoxyuridine (BrdU) incorporation assay for Ctl and shPW1 AdmMABs. Each assay was performed in triplicate. Data are represented as means ± s.d. ***P<0.0005, NS, not significant one-way unpaired t-test. (f,g) Real time analysis showing PW1 (f) and cycE (g) levels in NIH3T3 cells transfected with plasmid expressing PW1 (PW1) or an empty vector, as control (pEGFP) after 12 (12 h) and 36 h (36 h) from the transfection. Values are plotted as relative fold expression and normalized to GAPDH expression. Each assay was performed in triplicate. (h) BrdU incorporation assay on transfected NIH3T3 mouse fibroblasts. (i,j) Real time analysis showing PW1 (i) and CycE (j) levels on AdmMABs. Cells have been transiently transfected with plasmid expressing PW1 (PW1) and an empty vector, as control (pEGFP). Cells have been analysed after 12 (12 h) and 24 h (24 h) from the transfection. Values are plotted as relative fold expression and normalized to GAPDH expression. Each assay was performed in triplicate. (k) BrdU incorporation assay on transfected AdmMABs by incubating with 50 μM BrdU for 1 h, just before being stopped for the following qRT–PCR analysis. Each assay was performed in triplicate. All data are represented as means ± s.d. *P<0.05, **P<0.005, ***P<0.0005, ****P<0.0001, NS, not significant, one-way unpaired t-test.

