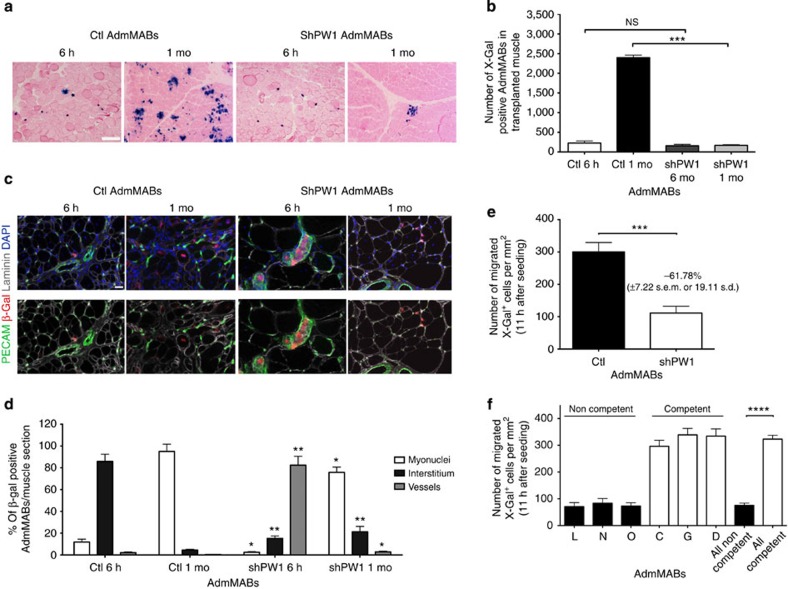
Figure 5. Silencing of PW1 impairs mesoangioblast ability to cross the vessel wall.
(a) Eosin and X-Gal staining on serial transverse sections of gastrocnemius muscle of transplanted scid-mdx mice, 6 h and 1 month (mo) after intra-arterial injection of n-LacZ Ctl and shPW1 cells. X-Gal was used to identify transplanted n-LacZ MABs. Scale bar, 200 μm. This observation has been quantified in the graph (b) Values are plotted as total number of X-Gal positive MABs in transplanted grastrocnemius muscles (n=4). Data are means (±s.d.) for each group. ***P<0.0005, NS, not significant, unpaired one-way t-test. (c) Immunofluorescence staining for laminin (grey), β-Gal (red), PECAM (green) and nuclei (DAPI) has been performed on the serial transverse sections of the transplanted muscle. Scale bar represents 25 μm. The result from this analysis has been quantified in the graph (d). Values are plotted as % of β-Gal positive MABs per muscle section (both Ctl and shPW1 AdmMABs) associated to vessel (PECAM positive), inside or outside (interstitium) the myofibres (by using laminin as reference). Statistical analysis has been performed comparing, for each time point, the shPW1 AdmMABs column with the respective Ctl column for the different markers. Each assay was performed in triplicate. All data are represented as means ± s.d.*P<0.5 **P<0.005, unpaired one-way t-test. (e,f) The H5V Endothelial cells were seeded on gelatin-coated filters. Ctl (AdmMABs) and shPW1 MABs (shPW1 AdmMABs) (e) or competent (C, G and D) and non-competent (L, N and O) AdmMAB clones (f) were added to the upper chamber and allowed to migrate for 11 h. Migrated MABs on the lower side of the filters (X-Gal blue nuclei) were fixed and counted. Quantification of migrated AdmMABs per area is shown. Data are means (±s.d.) from five independent experiments, each of these was run in triplicate. ***P<0.0005, ****P<0.0001, unpaired one-way t-test.

