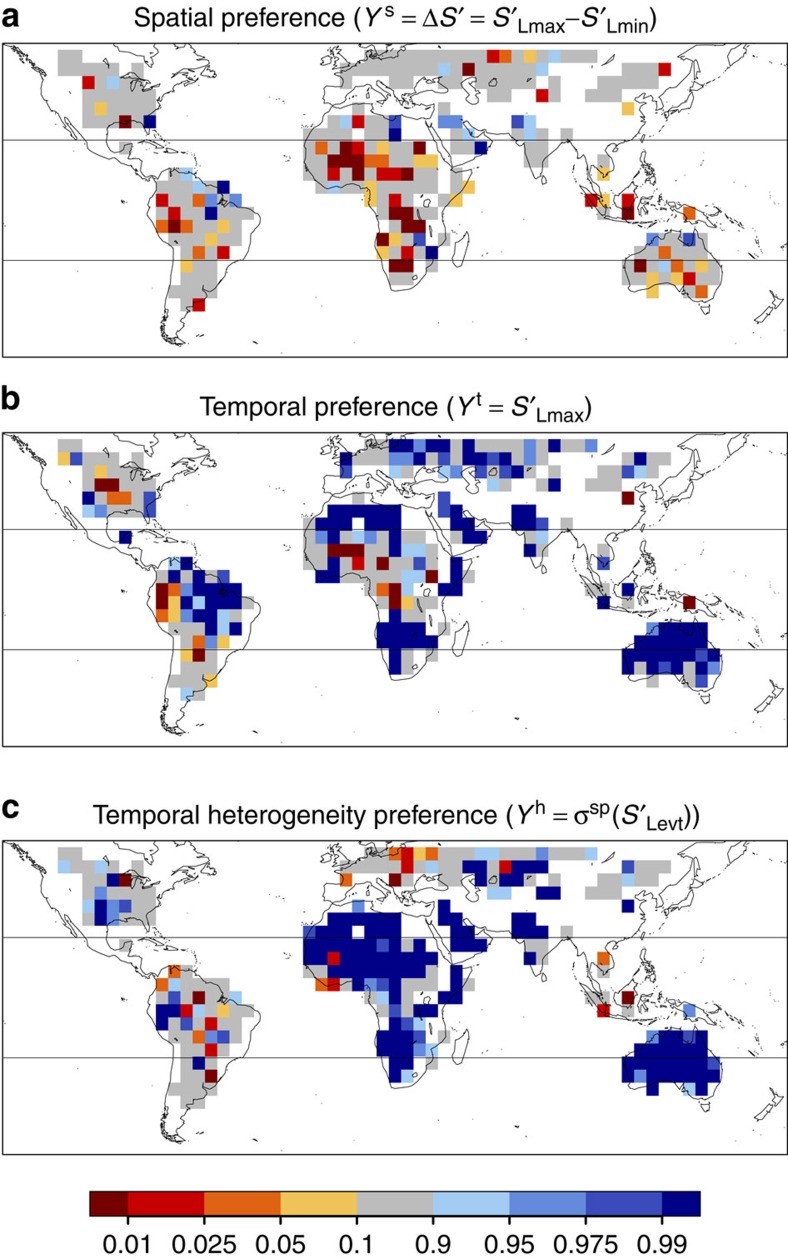
Figure 1. Preferences for afternoon precipitation over soil moisture anomalies.
(a) Spatial, (b) temporal and (c) heterogeneity preference. Quantile of the coupling metric δe(Y)=mean(Ye)−mean(Yc) under the Null hypothesis that no coupling exists, where Y is (a)  , the difference in S′ between the location of rainfall maximum and the location of rainfall minimum, (b)
  and (c)
  . Low (high) quantiles indicate where Y is lower (higher) than expected. Horizontal black lines indicate the latitudes at which different months are included in the analysis (see Methods). Grey shading indicates non-significant relationships, grid cells with <25 events are left white. Results from various data sets are shown in Supplementary Figs 1–4, 7 and 8.

