Fig. 7.

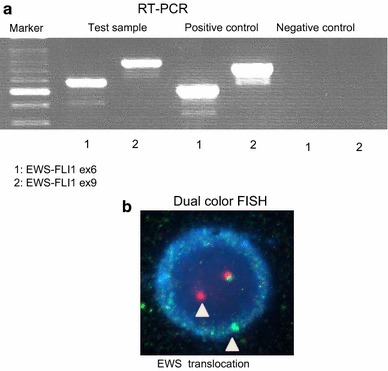
a RT-PCR. The left lane shows a marker, and the next three pairs of lanes (in a left-to-right direction) show the test samples, positive controls, and negative controls (1: EWS-FLI1 ex6, 2: EWS-FLI1 ex9), respectively. This figure shows that the test sample was positive for both EWS-FLI1 ex6 and EWS-FLI1 ex9, which means that the tumor possessed the EWS-FLI1 ex6 fusion gene. b FISH. An abnormal cell that has been hybridized with the Vysis LSI EWSR1 (22q12) dual color, break apart rearrangement probe. In a normal cell that lacks a t(22q12) translocation in the EWSR1 gene region, two fusion signals will be observed, reflecting the presence of two intact copies of EWSR1. The cell in this image shows one fusion, one orange, and one green signal, which is indicative of the rearrangement of one copy of the EWSR1 gene region
