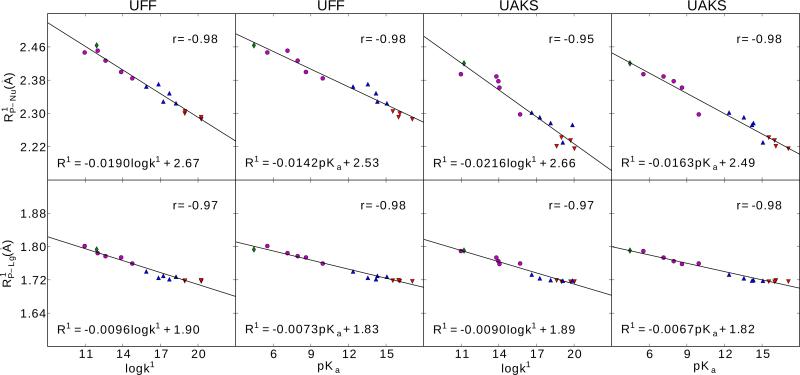
Figure 3.
Linear relationships between bond lengths ( and P-Nu P-Lg, Å) of early transition states (TS1) and the corresponding calculated rate constants (logk1) and experimental pKas of leaving groups. The calculation were performed using density-functional method with PCM solvation model and UFF (left) and UAKS (right) radii. Red down triangle, blue up triangle, purple round and green diamond symbols correspond to alkyl, hetero-alkyl, phenyl and acid leaving groups, respectively. Regression parameters for R1 are given as well as linear correlation coefficient for r.

