
Fig. 3.
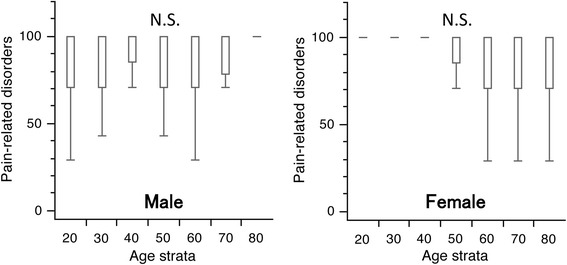
Box and whisker plots of scores for pain-related disorders in the Japanese Orthopaedic Association Back Pain Evaluation Questionnaire by gender and age group. The lines on the box correspond to the quartiles. Whiskers indicate the furthest point within 1.5× interquartile range from the box. There were no significant differences in the scores between any age groups in both genders (Steel–Dwass test). The scores had a tendency to increase with age in males and to decrease with age in females (Jonckheere–Terpstra test; p < 0.001 for both). N.S., not significant