
Fig. 5.
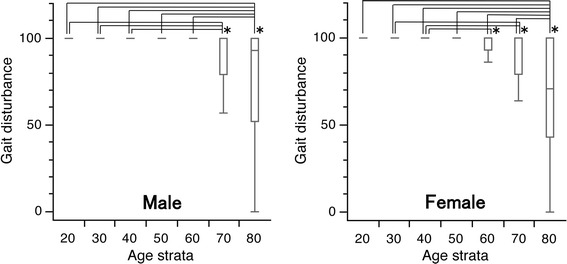
Box and whisker plots of scores for gait disturbance in the Japanese Orthopaedic Association Back Pain Evaluation Questionnaire by gender and age group. The lines on the box correspond to the quartiles. Whiskers indicate the furthest point within 1.5× interquartile range from the box. Significant differences were observed in the scores between younger subjects in their 20–60 s and elderly subjects in their 80 s for both genders, between male subjects in their 20–40 s vs. in their 70 s, between female subjects in their 40–60 s, in their 30 s and 40 vs. 70 s, and in their 70 s vs. 80 s (Steel–Dwass test; *p < 0.05 for all). The scores had a tendency to decrease with age in both genders (Jonckheere–Terpstra test; p < 0.001)