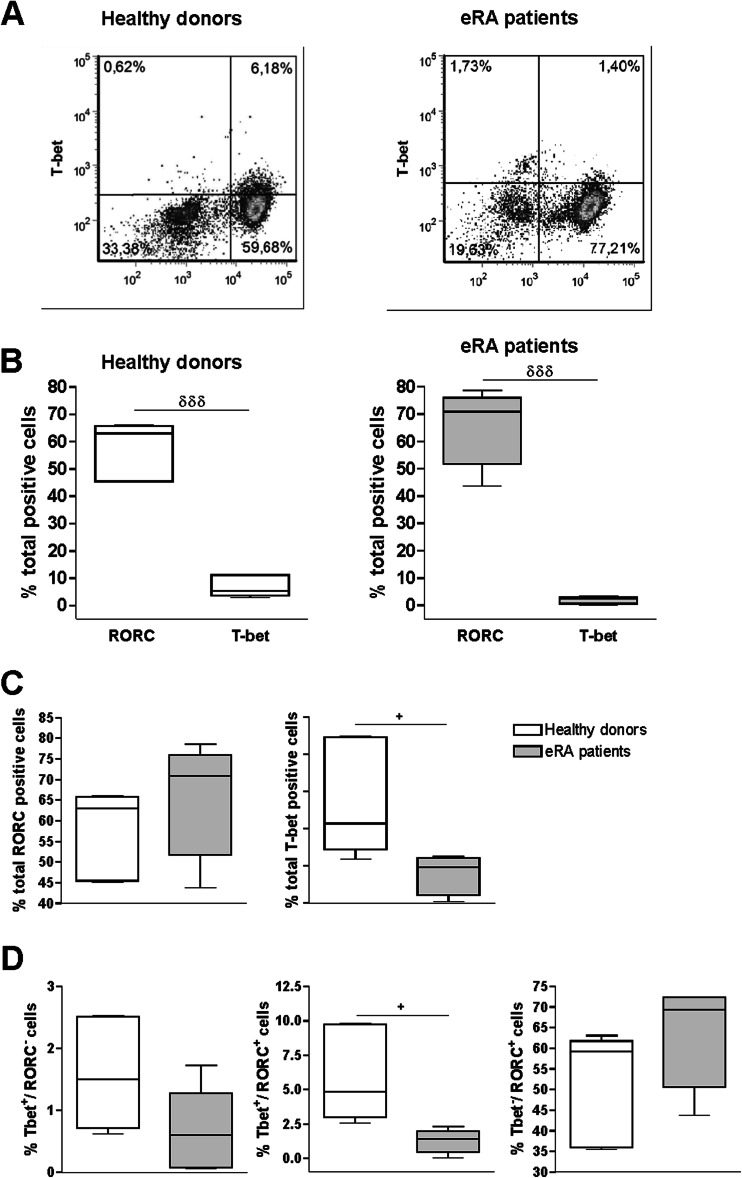
Fig. 1.
Th17 and Th1 phenotypes of activated/expanded memory Th cells from eRA patients and healthy donors. T-bet and RORC expression was determined by flow cytometry analysis in memory Th cells after activation/expansion for 7 days. Auto-fluorescence and isotype controls were set up to determine the non-specific fluorescence signal. a Figure shows a representative dot plot analysis indicating T-bet/RORC expression. b–c Figure shows the percentage of total RORC positive cells, total T-bet-positive cells. d Figure shows the percentage of T-bet+/RORC− cells, T-bet+/RORC+, and T-bet−/RORC+ cells. Data are the mean ± SEM of three different cultures, performed in triplicate. Differences between RORC and T-bet expression in CD4+CD45RO+ T cells were statistically significant, δδδ P < 0.001. Differences between CD4+CD45RO+T cells from HD and eRA patients were statistically significant, + P < 0.05

