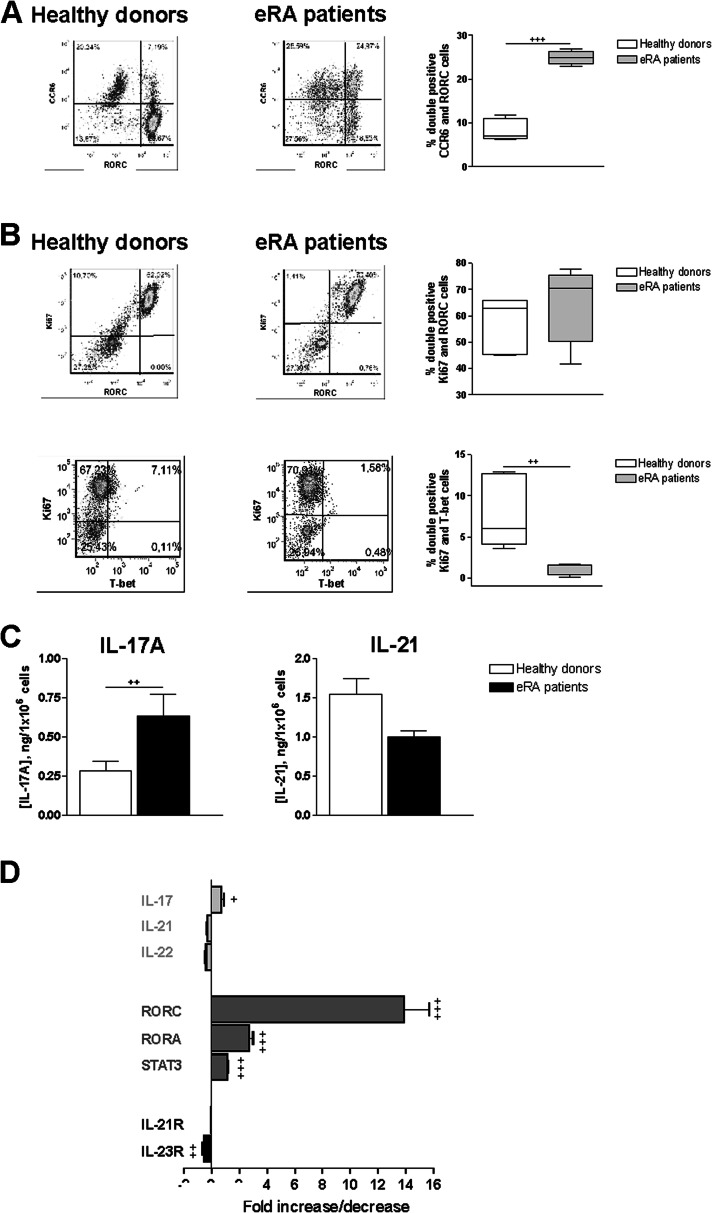
Fig. 2.
Th17 profile of activated/expanded memory Th cells from eRA patients and healthy donors. a CCR6 and RORC expression was determined by flow cytometry analysis in memory Th cells after activation/expansion for 7 days. Auto-fluorescence and isotype controls were set up to determine the non-specific fluorescence signal. The figure shows a representative dot plot analysis indicating CCR6/RORC expression. The percentage of CCR6/RORC double-positive cells was quantified. Data are the mean ± SEM of three different cultures, performed in triplicate. b Ki67/RORC and Ki67/T-bet expression were determined by flow cytometry analysis in memory Th cells after activation/expansion for 7 days. Auto-fluorescence and isotype controls were set up to determine the non-specific fluorescence signal. The figure shows two representative dot plot analysis indicating Ki67/RORC and Ki67/T-bet expression. Percentage of Ki67/RORC and Ki67/T-bet double-positive cells was quantified. Data are the mean ± SEM of three different cultures, performed in triplicate. c Protein expression of IL-17A and IL-21 was analyzed in culture supernatants by ELISA on day 7 of culture. Data are the mean ± SEM of eight different cultures, performed in duplicate. d mRNA expression of cytokines (light grey), transcription factors (dark grey), and cytokine receptors (black) was determined by real-time PCR in activated/expanded memory Th cells on day 7 of culture, after PMA and ionomycin stimulation. Data were analyzed normalizing with β-actin mRNA expression and compared with the mRNA expression of CD4+CD45RO+ T cells from HD. The fold change of each mRNA expression with respect to different conditions is represented. Data are the mean ± SEM of eight different cultures performed in triplicate. Differences between CD4+CD45RO+ T cells from HD and eRA patients were statistically significant, + P < 0.05, ++ P < 0.01, +++ P < 0.001

