Figure 5.
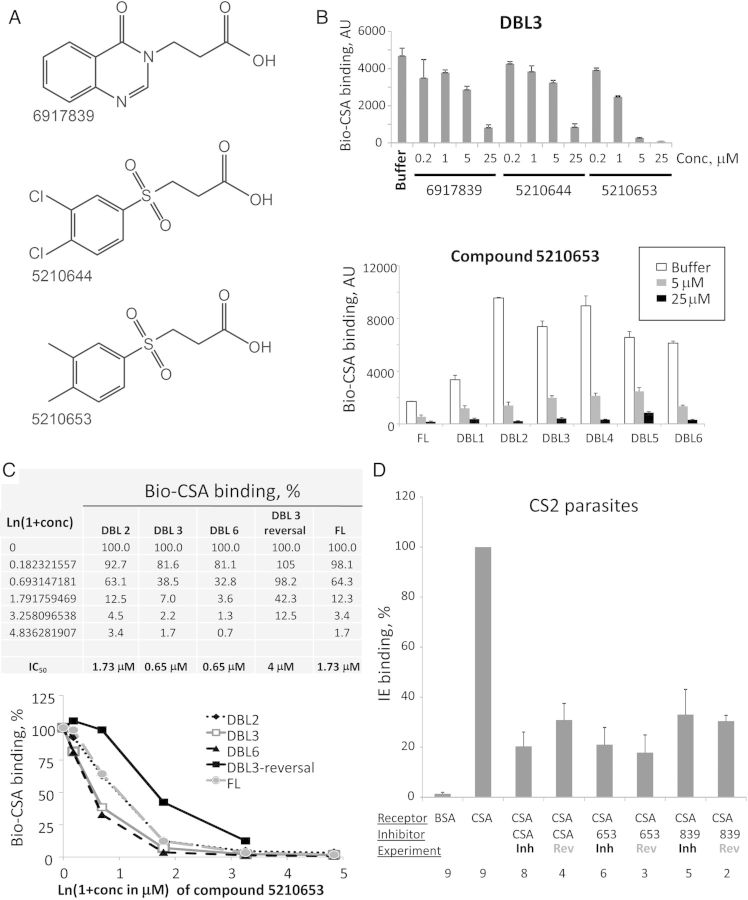
Characterization of CSA-binding inhibitory compounds. A, Chemical structures. B, Concentration-dependent inhibition. Error bars are standard deviations. C, Calculation of the median inhibitory concentration (IC50) for binding of VAR2CSA Duffy-binding-like (DBL) 2, DBL3, and DBL6 domains and the full-length extracellular part (FL), and for reversal of DBL3 with compound 5210653. Error bars are standard deviations. D, Inhibition and reversal of CS2 Plasmodium falciparum–infected erythrocyte binding to CSA immobilized on surface of plastic dish by two compounds. The last 3 digits of the tested inhibitory compound numbers are shown. Bars are means of independent experiments; error bars are standard errors of the mean. Numbers below the x-axis indicate the number of independent experiments. Concentrations used for inhibition/reversal: CSA, 50 µg/mL; compounds, 100 µM. Average binding (without inhibition) to CSA was about 150 IE per microscope field. Abbreviations: Conc, concentration; Inh, inhibition; Rev, reversal.

