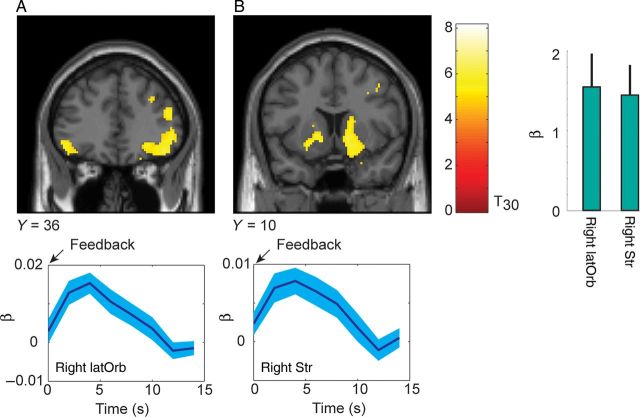
Figure 3.
Parametric modulation for reward outcome. Activations plotted at P < 0.05 FWE. Time series below each coronal section show mean and standard error from analysis of finite impulse response (FIR), for comparison. The FIR analysis was not used for inference of active clusters. The time course of a parametric modulator, as plotted here, indicates the time-course of significant covariation between the value of the modulator, and the value of the bold signal, over and above the actual event-related response. Histogram shows β weights and 90% CI from the GLM analysis. (A) Activation in lateral-orbital cortex that correlated with the size of the outcome. (B) Activation in ventral striatum.

