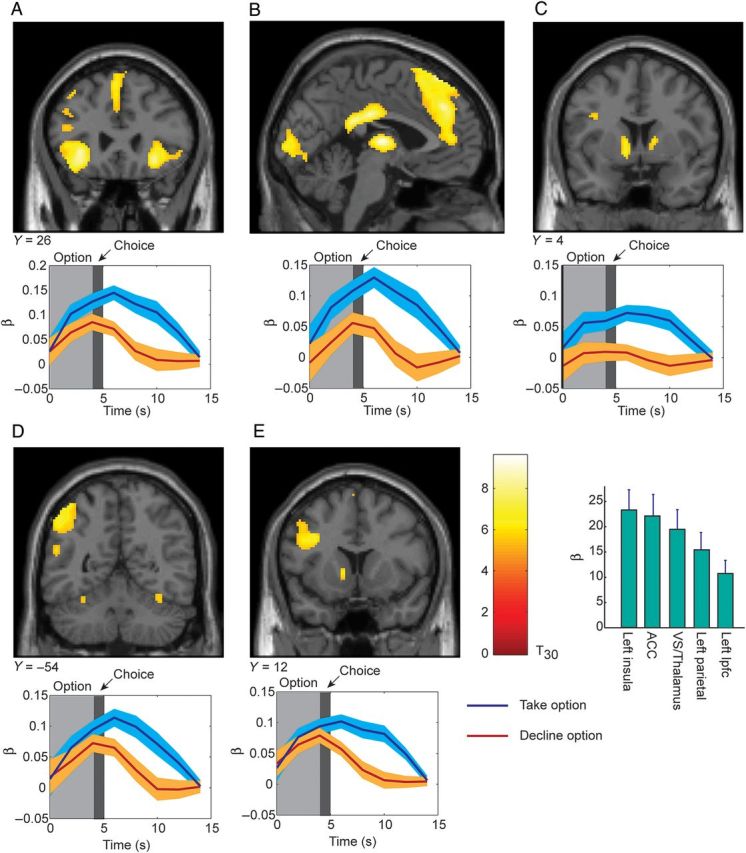
Figure 4.

Significant clusters for contrast of Take option versus Decline option. Coronal (and one sagittal) sections with significant voxels are shown on top. The time-course of activations from a FIR analysis is shown below each corresponding coronal section. Time zero is option onset, while choice indicates the time at which the subject entered their decision. Activations plotted at P < 0.05 FWE. Histogram shows β weights and 90% confidence interval from GLM analysis for each of the activations shown in (A–E). (A) Activation in left anterior insula. (B) Activation in anterior cingulate shown on a sagittal view. (C) Activation in ventral striatum. (D) Activation in dorsal parietal cortex. (E) Activation in lateral–prefrontal cortex.
