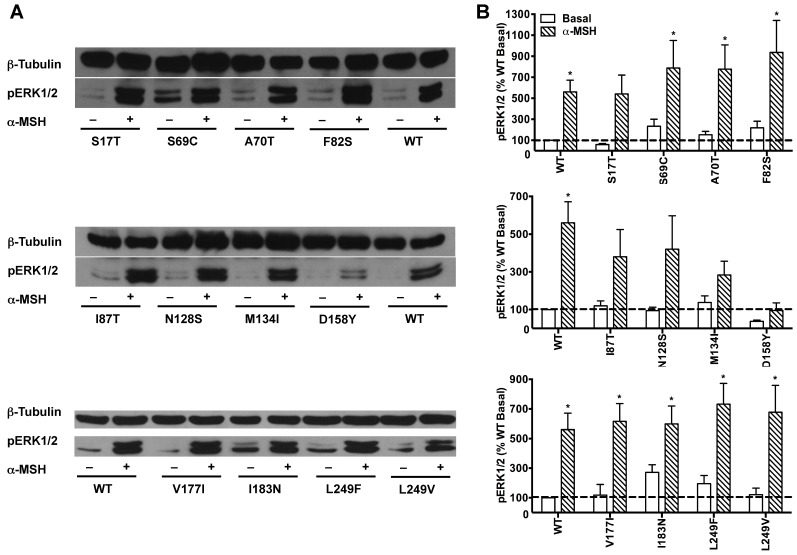
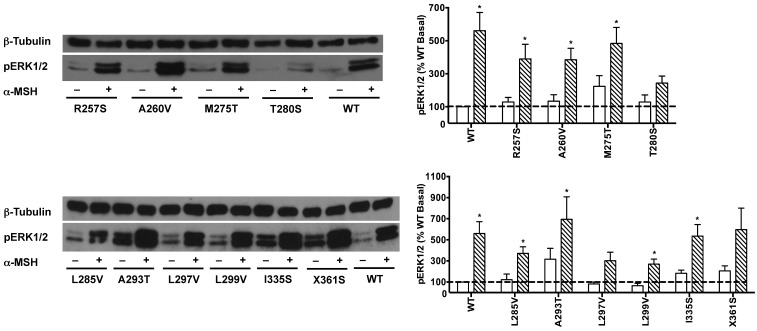
Figure 5.
The effect of α-MSH on ERK1/2 signaling in mutant hMC3Rs. HEK293T cells were stimulated with or without 10-5 M α-MSH for 5 min. ERK1/2 phosphorylation was measured as described in Materials and Methods. Panel A showed the representative image of one experiment. Panel B showed the densitometry results of ERK1/2 phosphorylation of the WT and mutant hMC3Rs. Results are expressed as the percentage of the value obtained in non-stimulated cells transfected with the WT hMC3R. Shown are mean ± SEM of at least four experiments. Star (*) indicates significantly different from WT basal level, P < 0.05.


