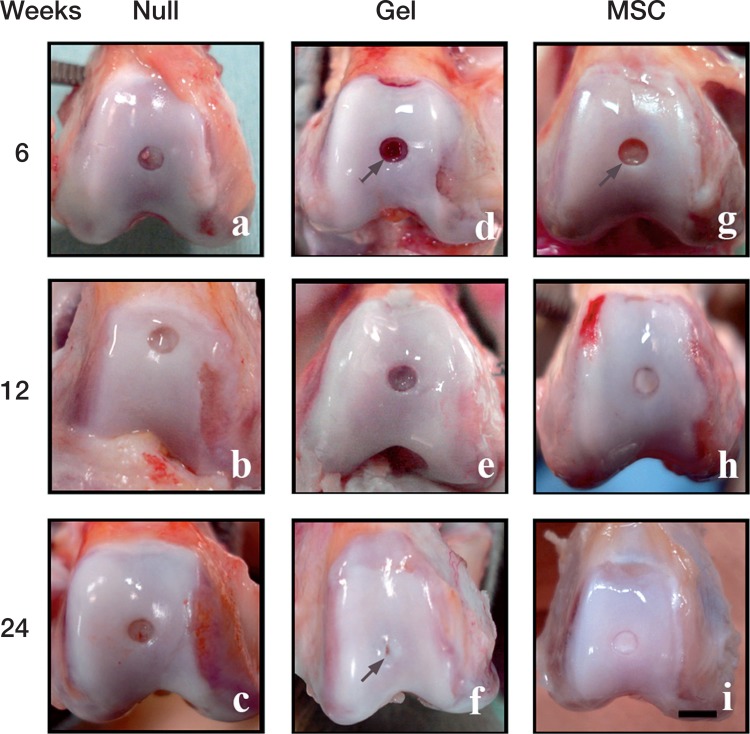
Figure 2.
Macroscopic observations of the repaired defects in the 3 groups at 6 weeks (a, d, g), 12 weeks (b, e, h), and 24 weeks (c, f, i) after implantation. Scale bar: 5 mm. Arrow in (d): the sharp edge of the defect is visible at 6 weeks in the gel group. Arrow in (f): a hollow-like deformity remains in the central region of the defect, despite thick coverage by the reparative tissue. Arrow in (g): the sharp edge of the defect is also visible in the MSC group at 6 weeks.

