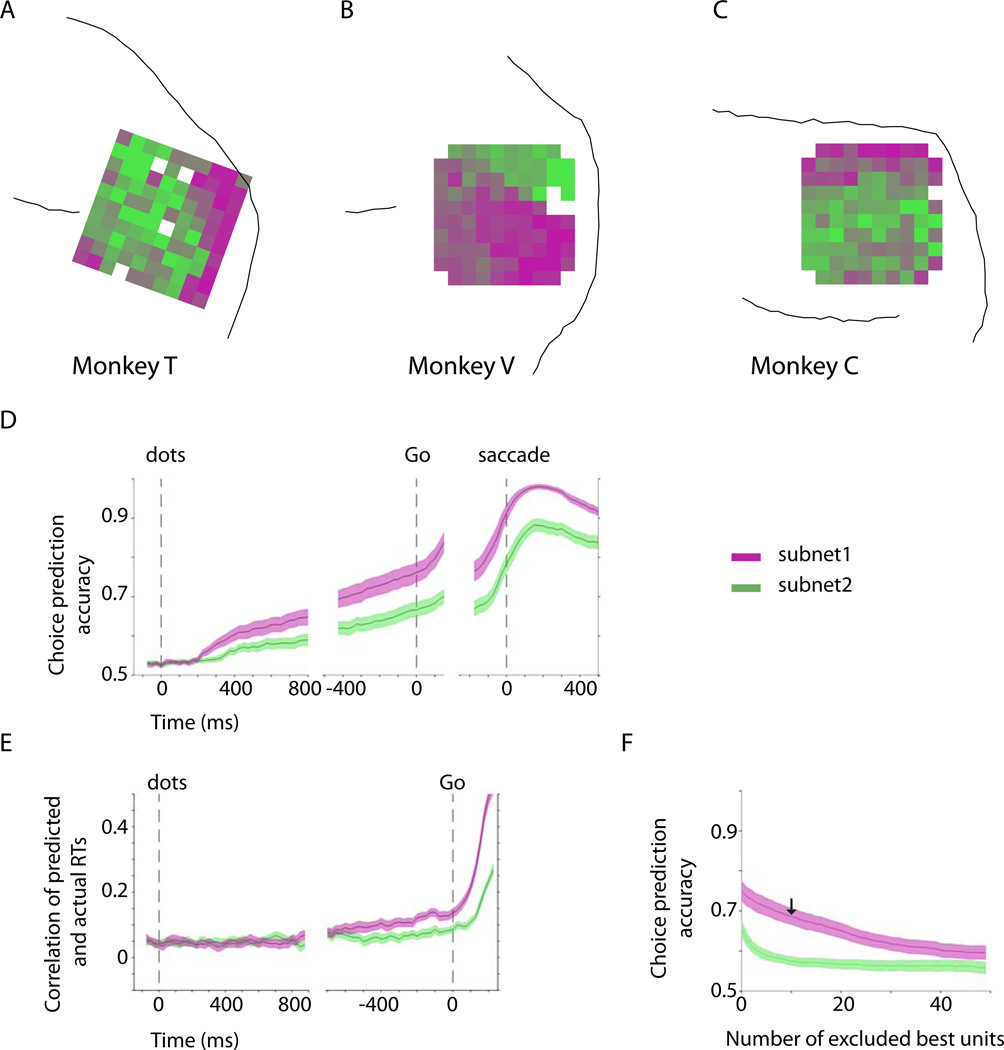
Figure 6.
Differential physiological properties of the two subnets. A–C) Average layout of the two subnets across the sessions for each monkey. We used K-means clustering to objectively divide the recorded units into two subnets in each session. The subnets were assigned magenta (subnet-1) and green colors (subnet-2) and projected back onto the arrays. The average maps across the sessions are shown for each monkey. The electrodes with in-between colors contributed to different subnets across experiments. D) Choice prediction accuracy based on a logistic regression analysis (see Supplemental Experimental Procedures) of the population responses of subnet-1 and subnet-2. E) RT prediction accuracy based on a linear Ridge regression analysis of the population responses of the two subnets. Subnet-1 is a better predictor of both choice and reaction time. RTs were measured from the Go cue. F) Choice predictive responses were more distributed in subnet-1. In each session we ranked individual units of subnet-1 and subnet-2 based on their choice prediction accuracy and then measured the effect of the exclusion of best units on the choice prediction accuracy of the population response. The arrow indicates prediction accuracy of subnet-1 after exclusion of its 10 best units. The analysis focuses on the 150 ms window immediately before the Go cue. The shaded areas represent SEM across sessions.

