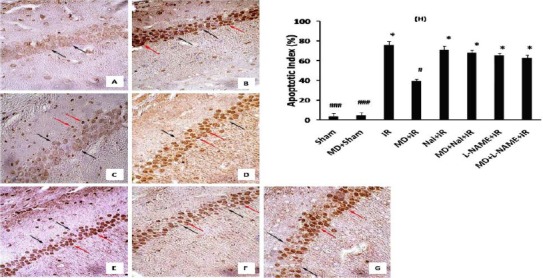
Figure 2.

Effects of morphine dependency on ischemia-induced apoptosis of hippocampal CA1 neurons. Representative pictures of sham (A), IR (B), MD+IR (C), Nal+ IR (D), MD+ Nal+ IR (E), L-NAME+IR (F) and MD+L-NAME+IR (G) 72 hr after ischemia (400×). Black arrows are indicating intact cells and red arrows indicating apoptotic cells. Data has been expressed as (Mean± SEM). One-way ANOVA followed by Ttucky test was applied to compare the mean percentage of apoptosis between groups. # P<0.05 and ### P<0.001 vs. IR group and *P<0.05 vs. MD+IR group (H)
