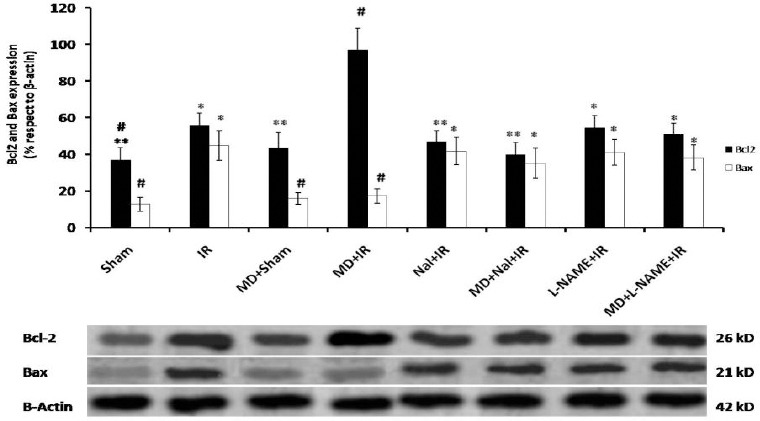
Figure 4.

Expression of pro-apoptotic protein Bax and anti-apoptotic protein Bcl-2 in samples prepared from hippocampal tissue after treatment. The results show the ratio of Bax or Bcl-2 protein expression to β-actin expression (upper panel). Data are shown as Mean ± SEM. Ischemia reperfusion (IR), morphine dependence (MD), Naloxone (Nal). One-way ANOVA followed by post-hoc Tucky test was applied to compare the mean rate of protein expression between groups. # P<0.05 and ## P<0.01 vs. IR group. *P<0.05 and **P<0.01 vs. MD+IR group
