
Figure 4.
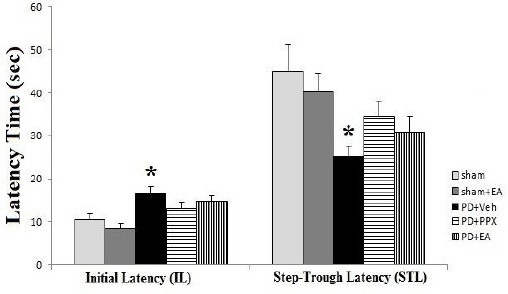
Passive avoidance test. The results were expressed as mean ± SEM (n=8). Data analyzed by one-way ANOVA followed by Tukey’s post hoc test for among multiple groups comparison. *P<0.05 vs. sham group
Official websites use .gov
A
.gov website belongs to an official
government organization in the United States.
Secure .gov websites use HTTPS
A lock (
) or https:// means you've safely
connected to the .gov website. Share sensitive
information only on official, secure websites.
Passive avoidance test. The results were expressed as mean ± SEM (n=8). Data analyzed by one-way ANOVA followed by Tukey’s post hoc test for among multiple groups comparison. *P<0.05 vs. sham group