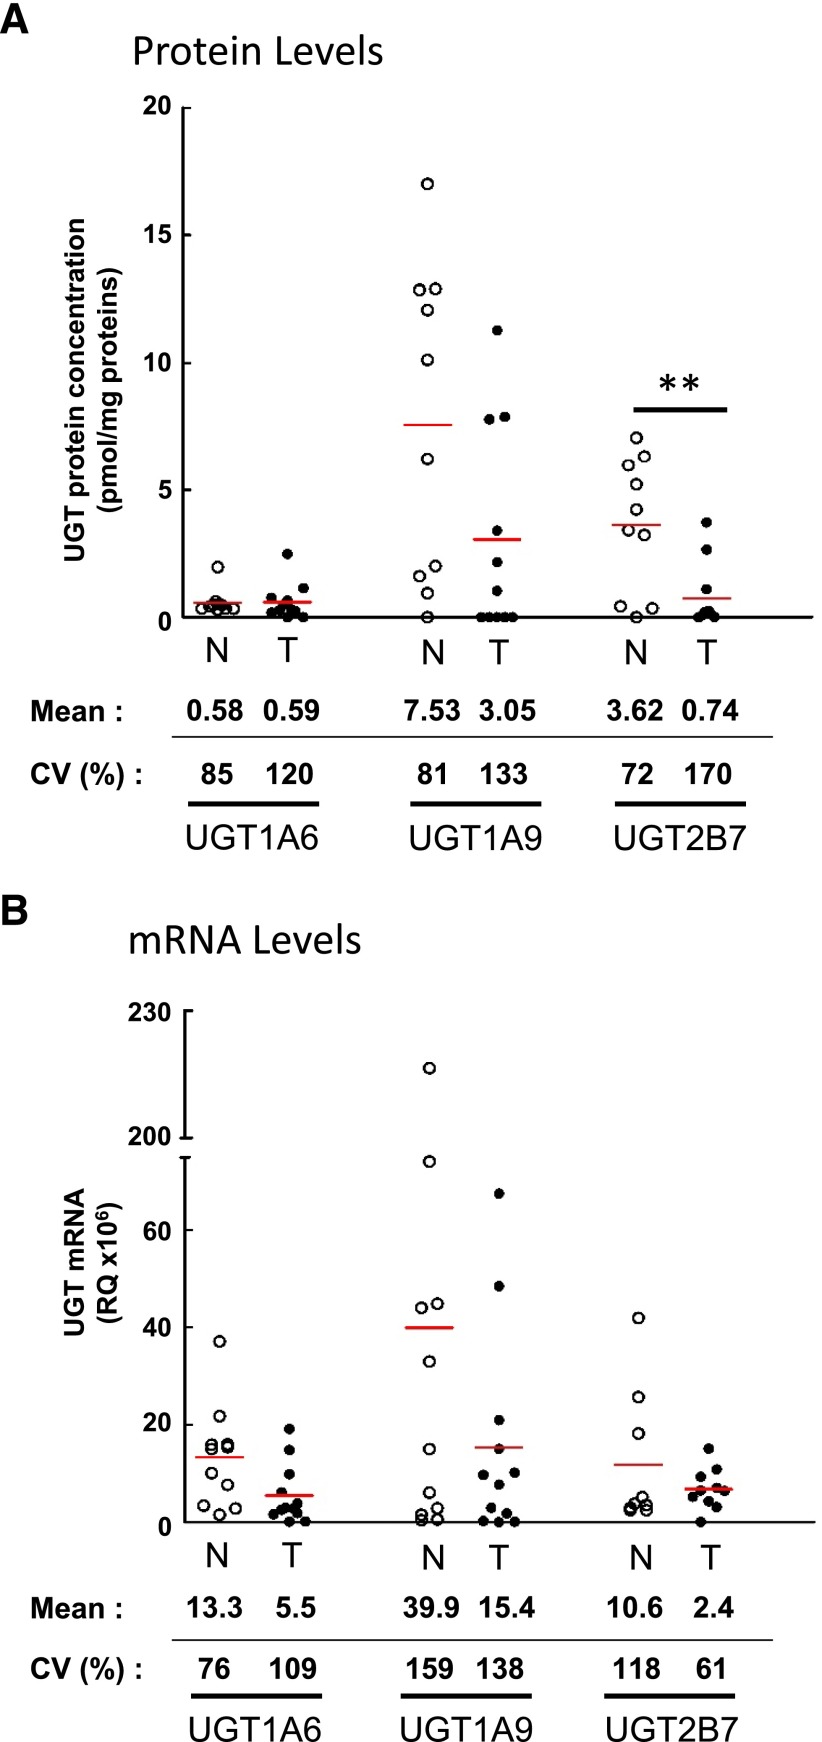
Fig. 1.
Expression profiles of UGTs in normal and tumoral kidneys. (A) Absolute quantification of protein concentrations determined by multiple reaction monitoring in normal (n = 10) and tumoral (n = 11) kidney homogenates. (B) Relative expression of UGT mRNA levels established by reverse transcription-quantitative PCR in normal (n = 11) and tumoral (n = 12) kidneys. mRNA quantification of UGTs used a general strategy enabling amplification of all known variants. N, normal kidneys (○); T, tumoral kidneys (●). Mean protein concentrations (pmol/mg proteins) and mRNA relative quantification (×106) of each UGT are given below the graph, as well as coefficients of variation (CV) among normal and tumoral samples. Detailed quantification data are given in Tables 1 and 2. **, P≤0.01.

