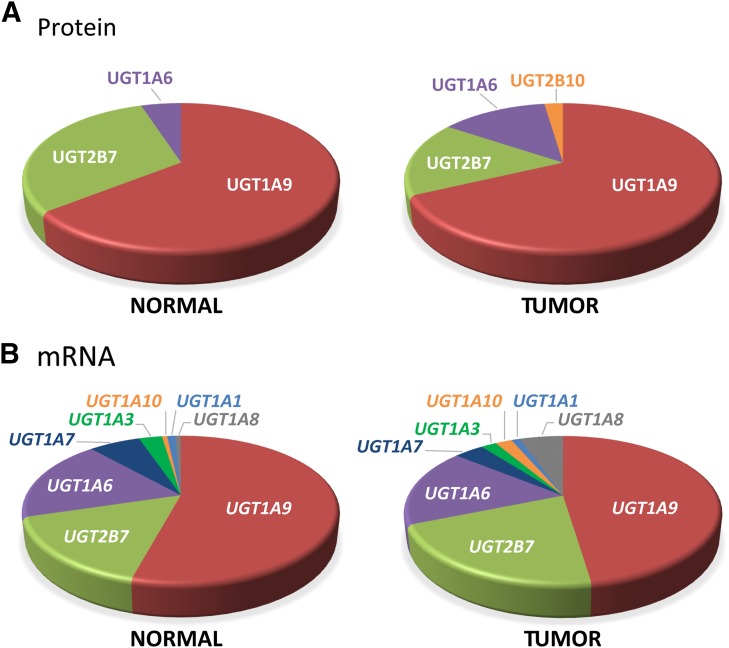
Fig. 2.
Relative UGT expression in normal and tumoral kidneys. (A) Relative protein concentrations of quantified UGTs in normal and tumoral kidneys, based on average concentrations from data shown in Fig. 1A and Tables 1 and 2. (B) Relative UGT mRNA expression in normal and tumoral kidneys based on reverse transcription-quantitative PCR quantification data shown in Fig. 1B and Tables 1 and 2.

