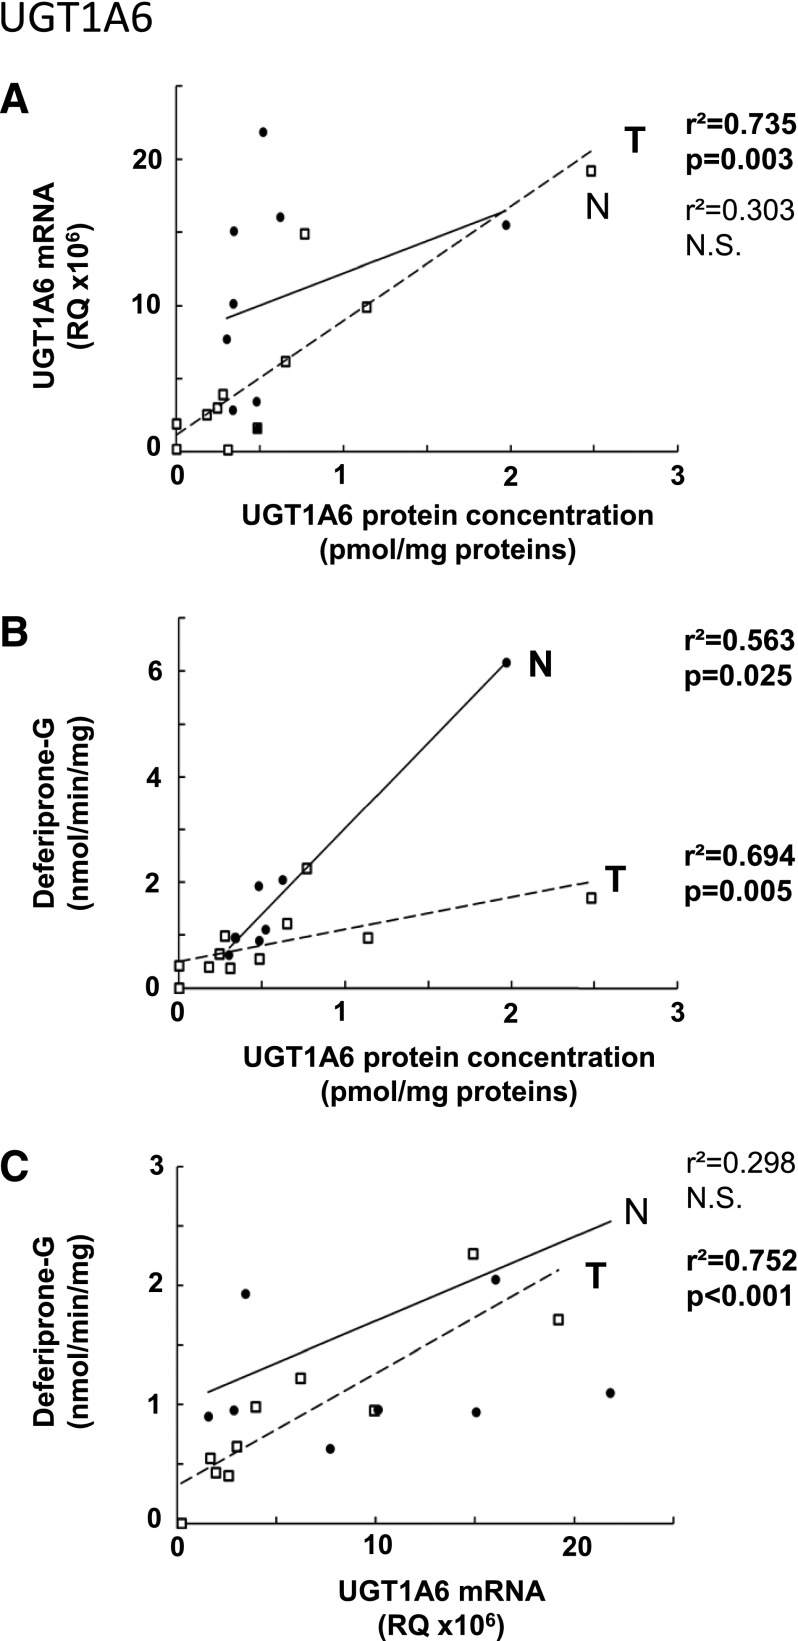
Fig. 4.
Correlation between UGT1A6 protein and mRNA levels (A); protein levels and deferiprone glucuronidation activity (B); mRNA levels and deferiprone glucuronidation activity (C) in normal (N, ●) and tumor (T, □) kidneys. The correlation coefficients r2 were determined using a Spearman correlation test. N.S., not significant.

