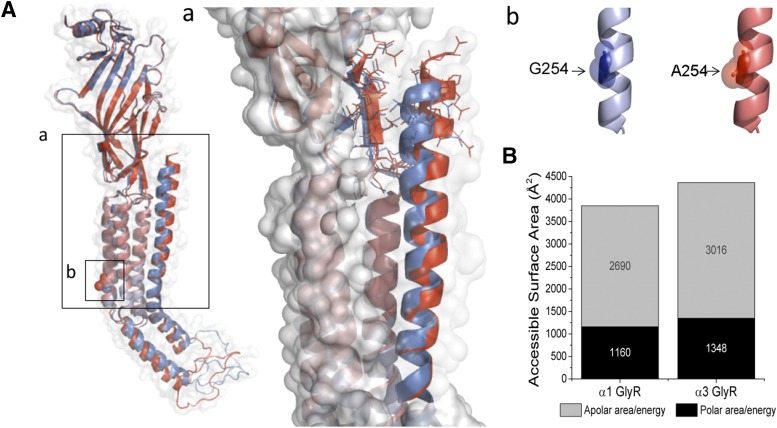
Fig. 8.
Molecular modeling of GlyR α1 and α3. (A) Structural alignment between α1 (blue) and α3 (red) including the magnification of the segment TM4–C terminus and the complementary region of extracellular domain showing the residues involved in structural stabilization (a). The TM2 residues described in this study are also highlighted (b). (B) Calculation of accessible solvent surface for both GlyR subunits supporting the idea of a “less packed” conformation for GlyR α3.

