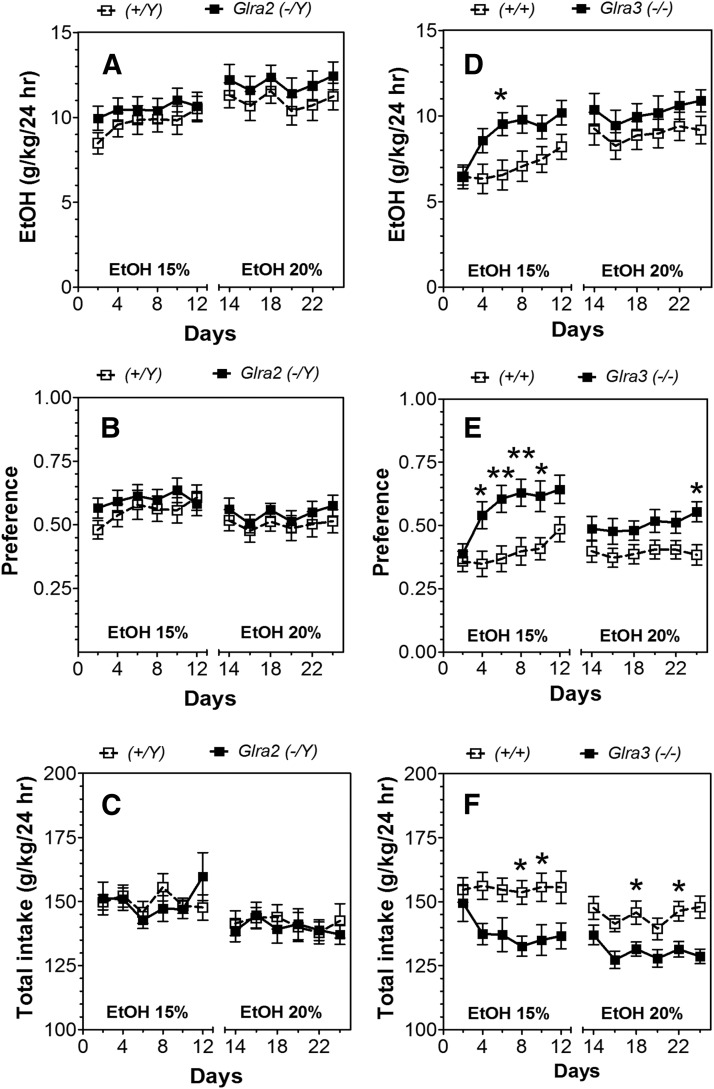
Fig. 2.
Increased voluntary ethanol consumption in Glra3(−/−), but not Glra2(−/Y) mice (24-hour two-bottle choice with intermittent access to ethanol). (A–C) Male Glra2(−/Y) and WT mice (n = 14–16 per genotype). (D–F) Male Glra3(−/−) and WT mice (n = 14–15 per genotype). (A and D) Ethanol consumption (g/kg per 24 hours). (B and E) Preference for ethanol. (C and F) Total fluid intake (g/kg per 24 hours). Values represent mean ± S.E.M. Data were analyzed by two-way repeated measures analysis of variance, followed by Bonferroni post hoc test (*P < 0.05, **P < 0.01 versus WT). EtOH, ethanol.

