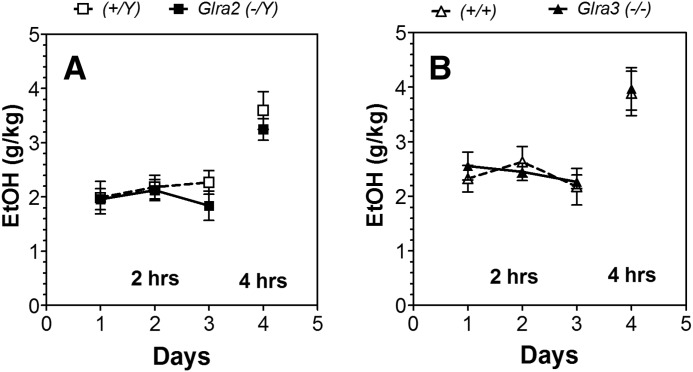
Fig. 3.
Lack of Glra2 or Glra3 did not alter ethanol consumption in the one-bottle drinking in the dark test (limited access to ethanol). (A) Male Glra2(−/Y) and WT mice (n = 10 for each genotype). Ethanol consumption for days 1–3 (g/kg per 2 hours) and day 4 (g/kg per 4 hours). (B) Male Glra3(−/−) and WT mice (n = 8 for each genotype). Ethanol consumption for days 1–3 (g/kg per 2 hours) and day 4 (g/kg per 4 hours). Values represent mean ± S.E.M. Data were analyzed by two-way repeated measures analysis of variance (days 1–3) or Student’s t test (day 4). EtOH, 15% ethanol.

