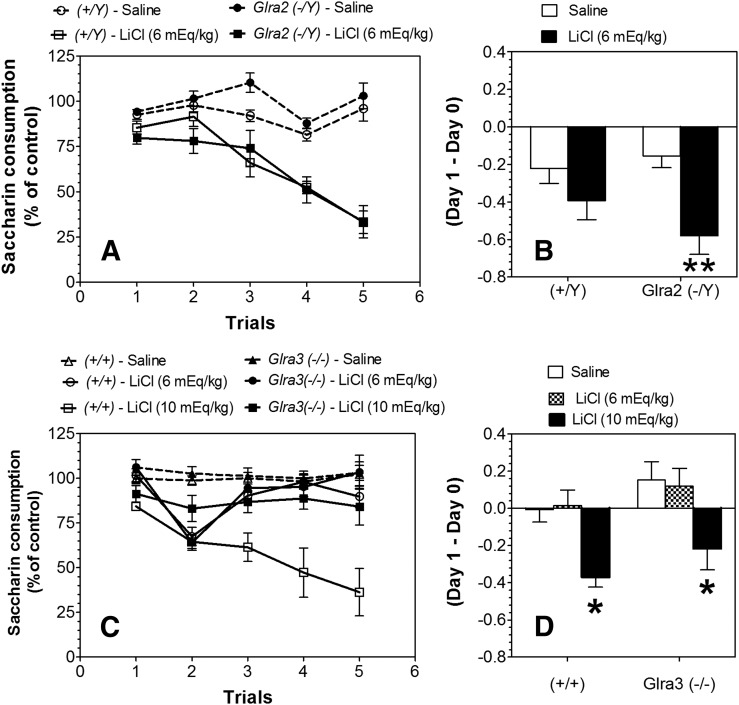
Fig. 5.
Increased initial aversive response to LiCl in Glra2(−/Y) and decreased development of CTA in Glra3(−/−) mice. (A) Development of CTA in male Glra2(−/Y) versus WT mice (n = 9 for saline per genotype; n = 9 for LiCl per genotype). Changes in saccharin consumption produced by injection of saline or LiCl (6 mEq/kg) are expressed as a percentage of the control trial (Trial 0). (B) Initial aversive response to LiCl in male Glra2(−/Y) versus WT mice. Values represent the difference between saccharin intake in the control trial (Trial 0) and intake after the first injection of LiCl (Trial 1). (C) Development of CTA in male Glra3(−/−) versus WT mice (n = 11–17 for saline per genotype; n = 7–10 for LiCl per genotype). Changes in saccharin consumption produced by injection of saline or LiCl (6 or 10 mEq/kg) are expressed as a percentage of the control trial (Trial 0). (D) Initial aversive response to LiCl in male Glra3(−/−) versus WT mice. Values represent the difference between saccharin intake in the control trial (Trial 0) and intake after the first injection of LiCl (Trial 1). Values represent mean ± S.E.M. Data were analyzed by two-way analysis of variance (B and D) or two-way repeated measures analysis of variance (A and C), followed by Bonferroni post hoc test (*P < 0.05, **P < 0.01 versus WT).

