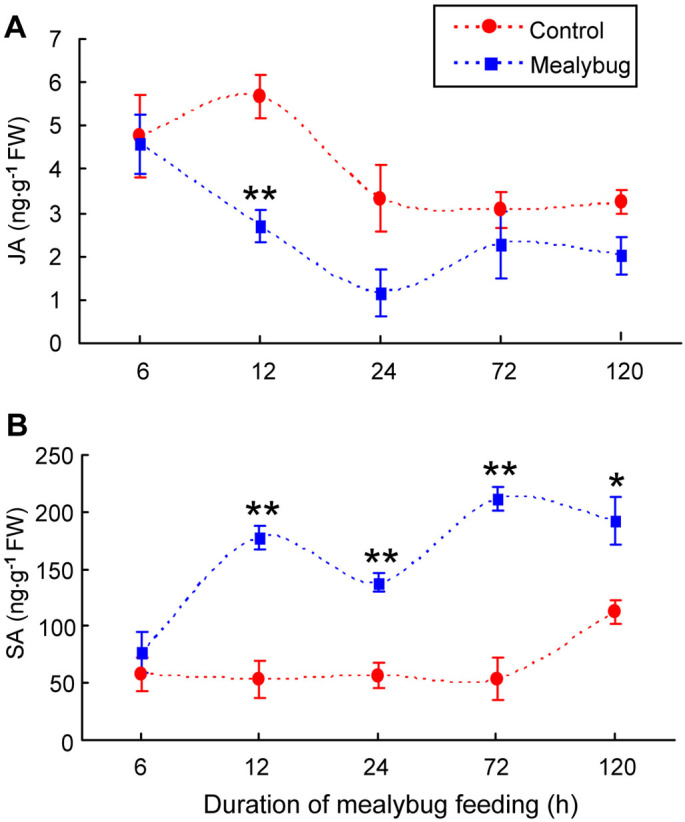
Figure 2. The accumulation of (A) JA and (B) SA in non-infested tomato leaves (Control) and in P. solenopsis-infested (Mealybug) tomato leaves at different time points.

Values are means ± SE of three biological replicates. Asterisks above bars indicated significant differences compared to the control (Fisher's PLSD test of ANOVA; * P < 0.05; ** P < 0.01). FW means fresh weight.
