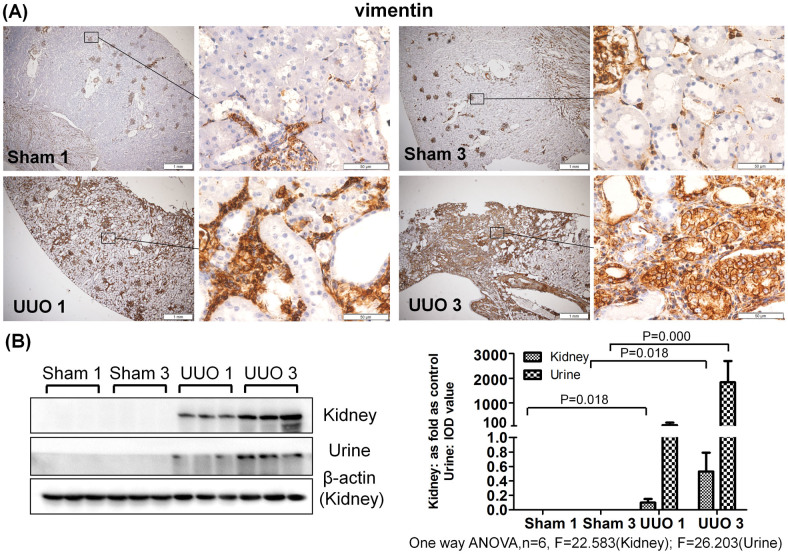
Figure 2. Vimentin accumulated in urine and obstructed kidneys after UUO.
(A) The expression and distribution of Vimentin in kidney analyzed by immunohistochemistry. (B) The expression of Vimentin in kidney and urine measured by western blot. The histogram shows quantitative representations of Vimentin in the kidney (normalized to β-actin) and urine (IOD value) obtained from densitometric analysis by IPP 6.0 software. The data represent mean ± SD. Sham 1: sham-operation 1-week group; Sham 3: sham-operation 3-week group; UUO 1: UUO 1-week group; UUO 3: UUO 3-week group.

