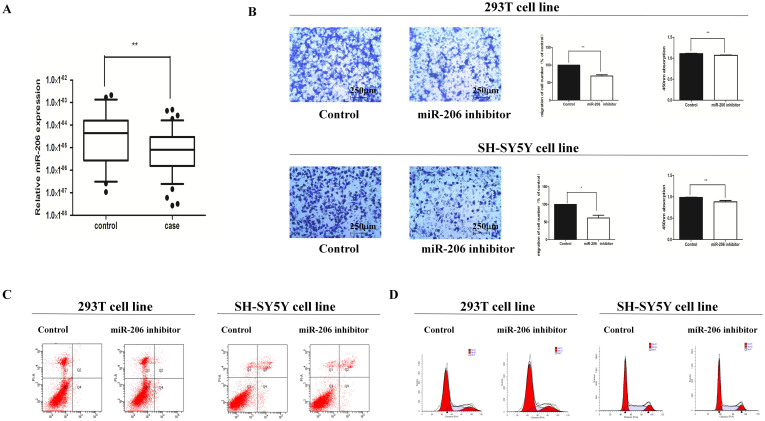
Figure 1. MiR-206 was down-regulated and its cell biological change after treating cell lines with miR-206 inhibitor.
(A): The relative expression levels of miR-206 in human HSCR tissues (n = 80) and control tissues (n = 80) were evaluated by qRT-PCR. Data were presented as box plot of the median and range of log-transformed relative expression levels. The top and bottom of the box represent the seventy-fifth and twenty-fifth percentile. The whiskers indicate the 10th and 90th points. * Significantly different compared with that of control (P < 0.05). (B): Transwell assay was performed as described in Materials and Methods. The representative images of invasive cells at the bottom of the membrane stained with crystal violet were visualized as shown (left). The quantifications of cell migration were presented as percentage migrated cell numbers (right). * indicates significant difference compared with control group (P < 0.05). Absorbance at 450 nm was presented with Mean ± SE. * indicates significant difference compared with control group P < 0.05. (C–D): Flow cytometry assay was performed to evaluate cell apoptosis and cell cycle.

