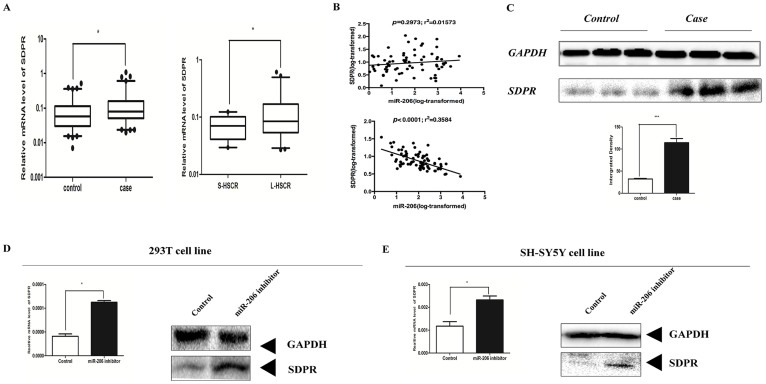
Figure 2. SDPR was up-regulated in HSCR cases and two cell lines.
(A): The mRNA expression levels of SDPR in human HSCR case and control tissues and the relative expression level of SDPR in S-HSCR and L-HSCR. (B): Correlation analysis between miR-206 and SDPR in controls and cases, respectively. The upper correlation was performed in controls and it showed poor relationships between miR-206 and SDPR, while the lower correlation analysis indicated that miR-206 is connected with SDPR in HSCR cases. (C): The protein expression levels of PTEN in human HSCR tissues and controls (3 representative samples from both groups are shown) (above). Quantization of Western-blotting was done by Image J software (blow). (D–E): Cells were transfected with 100 nM miR-206 inhibitor for 48 h, qRT-PCR was performed to evaluate the mRNA level of SDPR. SDPR protein expression levels were analyzed by western-blotting.

