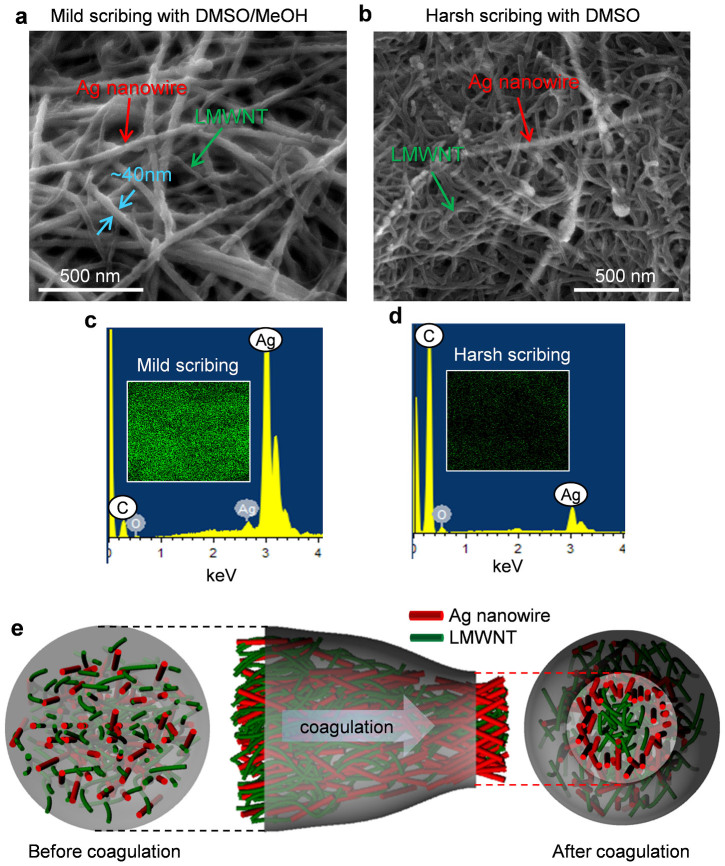
Figure 4. Characterisation of fibre surfaces.
(a), (b) FESEM images of QHB-LMWNT/PVA/AgNW (27.5:70:2.5 v/v/v) fibres prepared with 2 wt% paste after (a) mild scribing with DMSO–methanol mixture and (b) harsh scribing with DMSO. c, d) EDX data of QHB-LMWNT/PVA/AgNW (27.5:70:2.5 v/v/v) fibres after c) mild scribing and (d) harsh scribing. Inset images in (c) and (d) show EDX mapping images of Ag atoms. (e) Schematic illustration of the distribution of AgNWs and LMWNTs in the fibre before and after coagulation.

