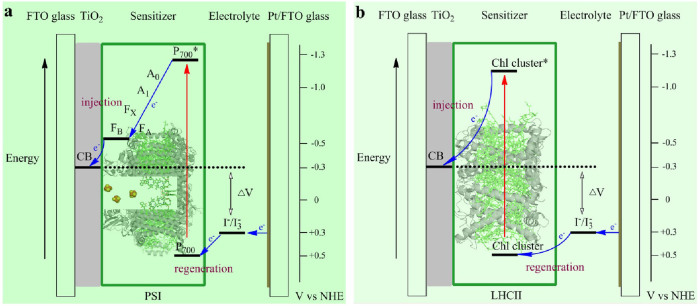
Figure 8. Simple energy level diagram for bio-sensitized solar cell.
The potentials are shown for (a) PSI-SSC and (b) LHCII-SSC. The primary free-energy losses are associated with electron injection from the excited sensitizer into the TiO2 conduction band (CB) and regeneration of the dye by the redox couple.

