. 2015 Jan-Mar;5(1):32–37. doi: 10.4103/2229-5151.152337
Copyright: © International Journal of Critical Illness and Injury Science
This is an open-access article distributed under the terms of the Creative Commons Attribution-Noncommercial-Share Alike 3.0 Unported, which permits unrestricted use, distribution, and reproduction in any medium, provided the original work is properly cited.
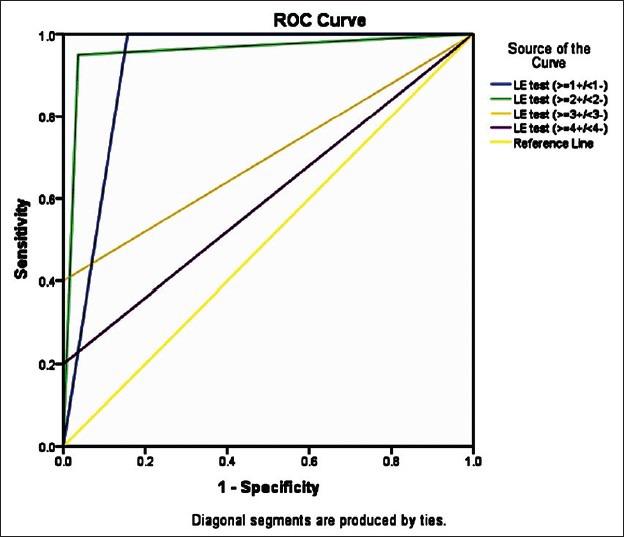
Figure 2.

ROC curve of the LE test taking 1, 2, 3 and 4 as cut offs
