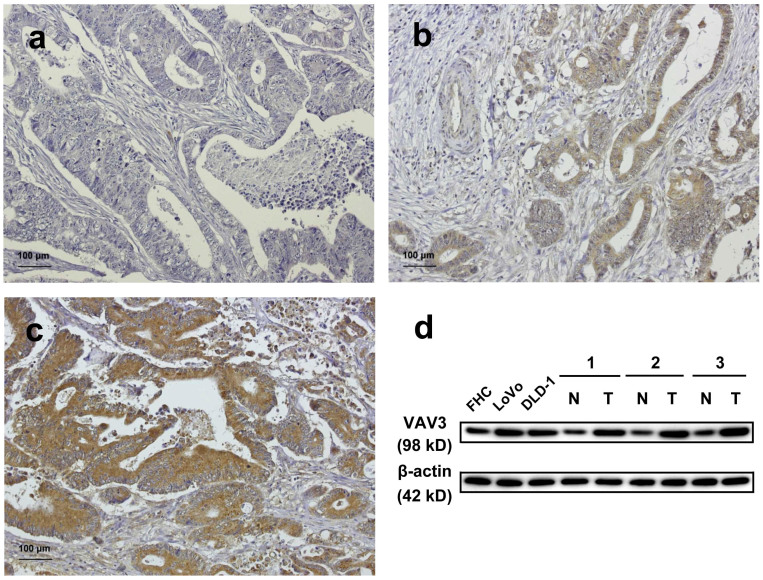
Figure 1. VAV3 expression in colorectal tissues and cell lines.
(a–c) CRC analyzed by immunohistochemistry with an antibody against VAV3. Panel a shows a sample without VAV3 expression; Panel b shows a sample with low VAV3 expression; Panel c shows a sample with high VAV3 expression. (d) Endogenous VAV3 protein expression was remarkably increased in CRC cell lines (LoVo and DLD-1) and tissues. N and T stand for non-tumor and tumor, respectively. No. 1, 2, 3 were patients number. The blots in the figure were cropped, but the polyacrylamide gels were run under the same experimental conditions.

