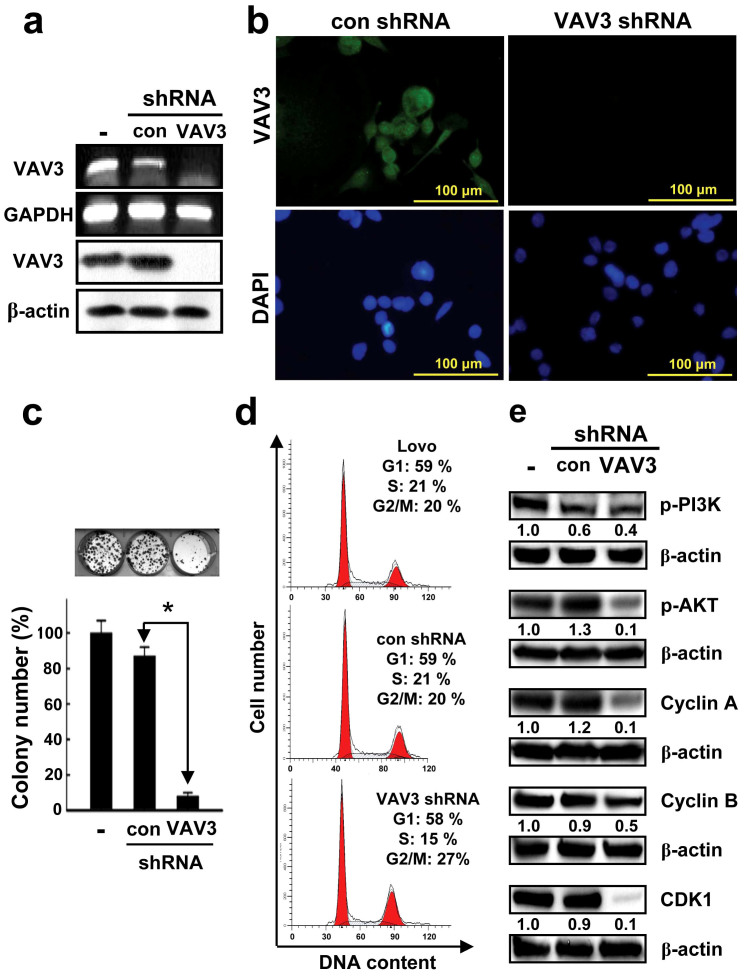
Figure 3. Verification of VAV3 knockdown in LoVo cells, and the effect of stable VAV3 knockdown on LoVo cell growth, cell cycle distribution, and the expression of cell cycle control molecules, phospho-PI3K, and phospho-AKT in LoVo cells.
The RT-PCR (a), immunoblotting (a) and immunofluorescence (b) results indicate complete knockdown of VAV3 mRNA and protein expression. The agarose gels in the figure were cropped. The blots in the figure were also cropped, but the polyacrylamide gels were run under the same experimental conditions. (c) Stable VAV3 knockdown results in significantly decreased colony formation. The photomicrographs shown are from one representative experiment performed in triplicate with similar results. The histogram represents the colony numbers (presented as the mean ± standard deviation (SD), *denotes P < 0.0001 compared with the control). (d) Stable VAV3 knockdown results in a sustained accumulation of cells in the G2 phase. Cellular distribution (as percentages) in different phases of the cell cycle (G1, S, and G2/M) is presented as the mean ± SD of 3 independent experiments (*denotes P < 0.001 compared with the control). (e) Stable VAV3 knockdown decreases the expression of cell cycle control molecules and the levels of phospho-PI3K and phospho-AKT. The typical result from 3 independent experiments is shown. The blots in the figure were cropped, but the polyacrylamide gels were run under the same experimental conditions.

