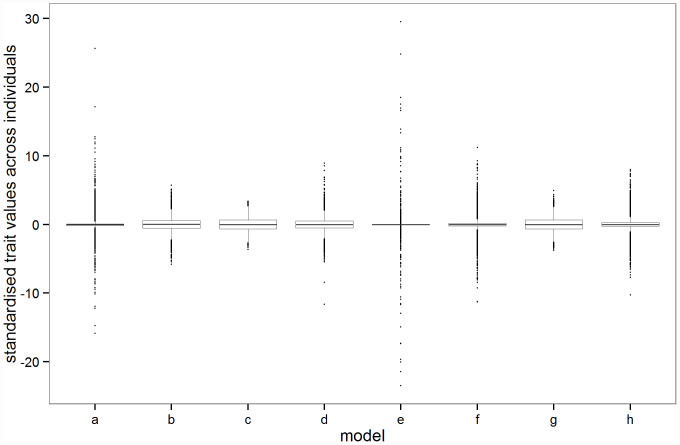
Figure 2. Distribution of the trait from run 1 of each model.
These are representative of the 100 replicate runs with each parameter combination. The model parameters are given in Table 1. Trait values were standardised for each model by subtracting the mean and dividing by the standard deviation. The whiskers extend from the 25th and 75th percentiles to values within 1.5 x the inter-quartile range25.

