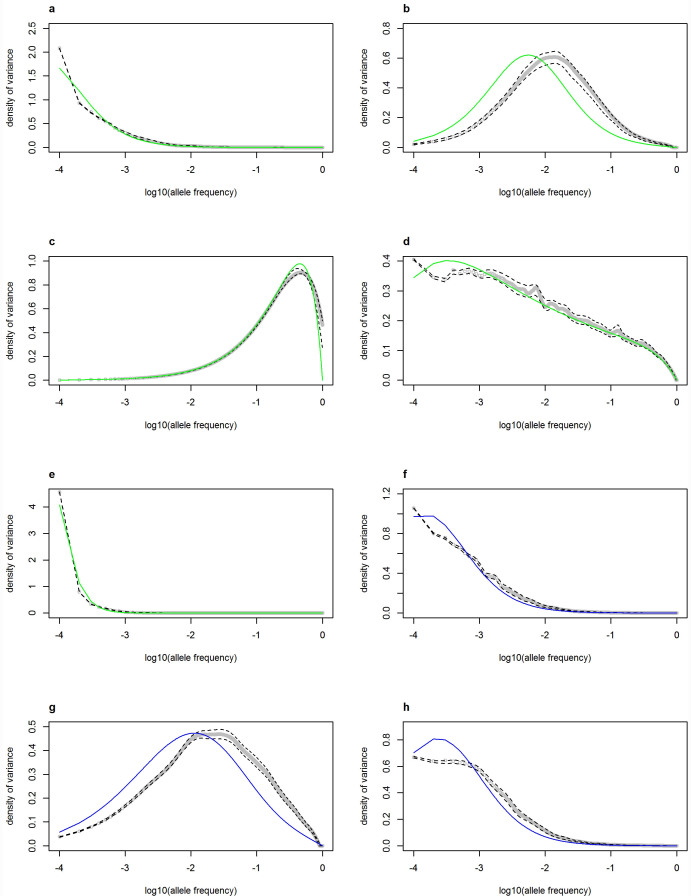
Figure 4. The density of the variance of the trait as a function of allele frequency.
The parameters for panels a–h are provided in Table 1 and are (a)  , τ = 1 (b)
  , τ = 1 (c)
  , τ = 0 (d)
  , τ = 0.5 (e)
  , τ = 2 (f)
  , A = 10,000,B = 10,000 (g)
  , A = 4,000,B = 40 (h)
  , A = 4,000,B = 4,000. The solid green lines (a–e) show the analytical predictions from the theory in Eyre-Walker6, and the blue lines (f–h) are from numerical integration using the saturating function model. The open grey circles give fitted values for each frequency after smoothing using 100 replicate simulations, as described in Methods. The dashed lines give a 95% confidence interval for the fitted values.

