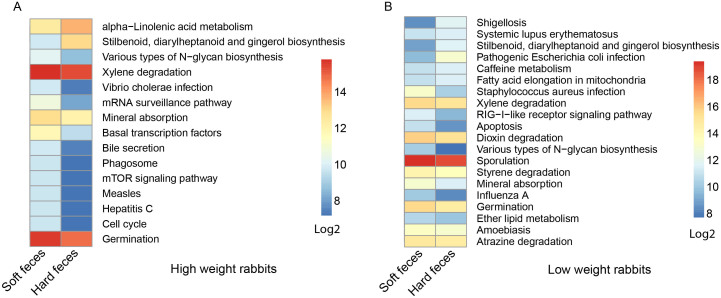
Figure 7. Predicted function of gut micorbiota between the hard and soft feces in high weight (A) and low weight (B) rabbits.
The gene copy numbers of samples within the same sample group were pooled. Values of each functional gene (row) were log2 transformed. The third level of KEGG pathway was shown in the heatmap. The significant test of the gene distribution between groups were performed using bootstrap Mann-Whitney u-test with cutoffs of p <0.01, FDR <0.1, Mean counts> 10.

