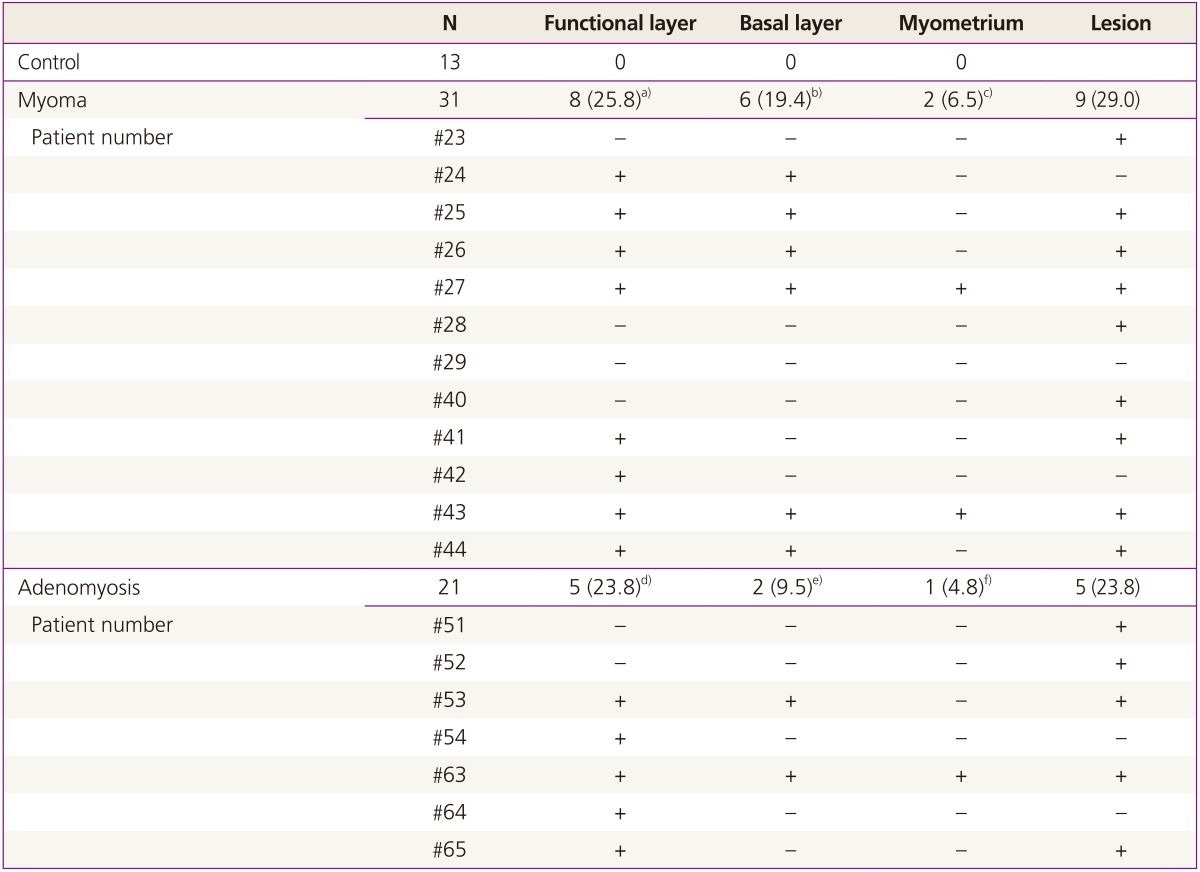
Table 2. Distribution of NF-positive cells in women who showed positive NF stain in at least one location (0 women with CIS [controls], 11 with myoma, and 7 with adenomyosis).

Values are presented as n (%).
NF, neurofilament; CIS, carcinoma in situ; -, NF staining negative; +, NF staining positive.
a)Fisher's exact test P-value is 0.082 between control and myoma group; b)Fisher's exact test P-value is 0.163 between control and myoma group; c)Fisher's exact test P-value is 0.523 between control and myoma group; d)Fisher's exact test P-value is 0.132 between control and adenomyosis group; e)Fisher's exact test P-value is 1.000 between control and adenomyosis group; f)Fisher's exact test P-value is 1.000 between control and adenomyosis group.
